This site uses cookies. By continuing to browse the ConceptDraw site you are agreeing to our Use of Site Cookies.

Competitor Analysis

Competitor analysis is a first and obligatory step in elaboration the proper corporate marketing strategy and creating sustainable competitive advantage. Use powerful opportunities of numerous solutions from ConceptDraw Solution Park for designing illustrative diagrams, charts, matrices which are necessary for effective competitor analysis.

Successful Strategic Plan

This sample shows the Strategic Plan of the Broadband Lifecycle that was developed by Strategic Networks Group. The Broadband Lifecycle represents the advance of the broadband investments.

Stakeholder Onion Diagrams

The Stakeholder Onion Diagram is a popular and widely used way to view the relationships of stakeholders to a project goal. The Onion Diagram focuses on the project goal, most of other diagram styles focus on the project, stakeholders, and timeline. This difference favorably distinguishes and separates the Onion Diagram from other types of diagrams.
Design fast and easy Stakeholder Onion Diagrams of any complexity in ConceptDraw DIAGRAM diagramming and vector drawing software using the powerful tools of Stakeholder Onion Diagrams Solution from the Management Area of ConceptDraw Solution Park.

fishbone diagram, Ishikawa diagram, cause and effect analysis Fishbone Diagrams

fishbone diagram, Ishikawa diagram, cause and effect analysis
The Fishbone Diagrams solution extends ConceptDraw DIAGRAM software with the ability to easily draw the Fishbone Diagrams (Ishikawa Diagrams) to clearly see the cause and effect analysis and also problem solving. The vector graphic diagrams produced using this solution can be used in whitepapers, presentations, datasheets, posters, and published technical material.

SWOT Analysis Tool for Small Business

SWOT analysis is a method of the making plan to evaluate the Strengths, Weaknesses, Opportunities, and Threats involved in a project. It involves specifying the objective of the project and identifying the internal and external causes for the accomplishing project goals.

Identifying Quality Management System

The Total Quality Management Diagram solution helps your organization visualize business and industrial processes. Create Total Quality Management diagrams for business process with ConceptDraw software.

logistics flow charts, logistics planning, logistics and supply chain, logistics management software, inventory flow chart Logistics Flow Charts

logistics flow charts, logistics planning, logistics and supply chain, logistics management software, inventory flow chart
Logistics Flow Charts solution extends ConceptDraw DIAGRAM functionality with opportunities of powerful logistics management software. It provides large collection of predesigned vector logistic symbols, pictograms, objects and clipart to help you design with pleasure Logistics flow chart, Logistics process flow diagram, Inventory flow chart, Warehouse flowchart, Warehouse management flow chart, Inventory control flowchart, or any other Logistics diagram. Use this solution for logistics planning, to reflect logistics activities and processes of an enterprise or firm, to depict the company's supply chains, to demonstrate the ways of enhancing the economic stability on the market, to realize logistics reforms and effective products' promotion.

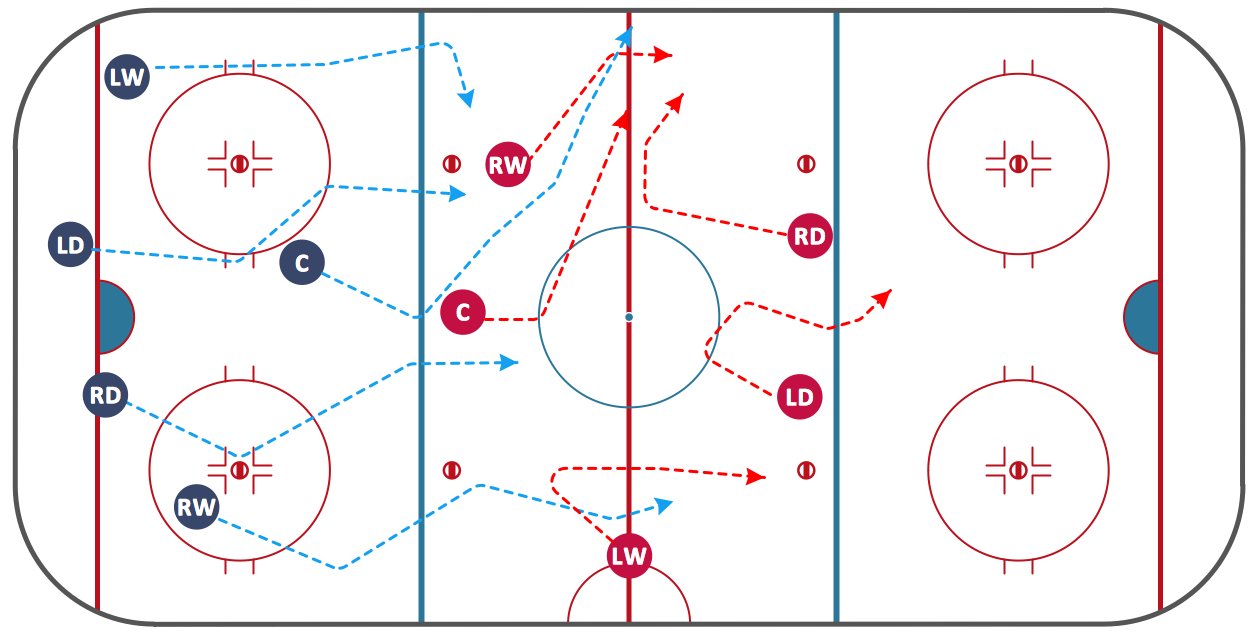
Ice Hockey Diagram — Defensive Strategy — Neutral Zone Trap

In ConceptDraw DIAGRAM you can produce ice hockey diagrams of any complexity for any presentaion needs, using a combination of tools. To adopt the sample below for presentation needs place positions and arrows onto different layers of your document and then make them visible one by one during a presentation.

TQM Software — Build Professional TQM Diagrams

The Total Quality Management Diagram solution helps you and your organization visualize business and industrial processes. Create Total Quality Management diagrams for business process with ConceptDraw software.

Software for Creating SWOT Analysis Diagrams

The ConceptDraw is a software for creating SWOT analysis diagrams. The SWOT Analysis solution includes the SWOT matrix samples, and templates that allow users create own SWOT and TOWS diagrams. Use the integration between the MINDMAP and DIAGRAM applications for fast drawing the SWOT matrix.

Powerful Drawing Feature for Creating Professional Diagrams

This will let you create professional diagrams and charts using its simple RapidDraw option just in clicks. Take a look on a diagram you are looking for and create it fast and quickly.

ConceptDraw Solution Park ConceptDraw Solution Park

ConceptDraw Solution Park
ConceptDraw Solution Park collects graphic extensions, examples and learning materials

SWOT Sample in Computers

The ConceptDraw is a best diagram software. The SWOT Analysis solution includes the SWOT matrix samples, and templates that allow users create own SWOT diagram.

Pyramid Diagram

The Project Management Triangle Diagram depicts three main constraints of any project: scope, time and cost. Projects have to comply with the specified scope, projects should be finished in time and projects need to consume the budget. Each of the constraints represents one side of the triangle, and any change in budget or timing or scope affects the entire diagram.

Management Tools — Total Quality Management

The Total Quality Management Diagram solution helps your organization visualize business and industrial processes. Create Total Quality Management diagrams for business process with ConceptDraw software.