IDEF0 standard with ConceptDraw DIAGRAM

Organizational Charts with ConceptDraw DIAGRAM

Organigram HR

Flowchart Programming Project. Flowchart Examples

Garrett IA Diagrams with ConceptDraw DIAGRAM

 Line Graphs
The Line Graphs solution extends the capabilities of ConceptDraw DIAGRAM with professionally designed templates, samples, and a library of vector stencils for drawing perfect Line Graphs. Turn your data into a Line Graph with ConceptDraw DIAGRAM software and use it in any document, presentation, report, share it with your team, etc. Building several curves on the same chart, it is recommended to paint them with different colors, this will allow to separate them visually from each other and will make it easier the data comparison.
Basic of Flowchart: Meaning and Symbols


 Business Processes Area
Solutions of Business Processes area extend ConceptDraw DIAGRAM software with samples, templates and vector stencils libraries for drawing business process diagrams and flowcharts for business process management.
The Best Business Process Modeling Software: Comprehensive Guide


IDEF3 Standard

Business Process Modeling Software for Mac

 EXPRESS-G data Modeling Diagram
EXPRESS-G data Modeling Diagram solution extends the ConceptDraw DIAGRAM software functionality with capabilities of EXPRESS data modeling language, includes powerful data modeling tools, Express-G diagram tool, database diagram tool, database design tool, wide variety of pre-made vector objects of EXPRESS-G notation and EXPRESS-G diagrams samples allowing software developers, software designers, software engineers and other stakeholders to make their data models for information systems, to develop the databases, to learn the principles of construction EXPRESS-G diagrams and helping to draw their own EXPRESS-G Data Modeling Diagrams, Express-G Diagrams or Database Model Diagram without any efforts.
The vector stencils library "Transport map" contains 96 pictograms for drawing transport maps.
Use it in your spatial infographics for visual representation of transport schemes and plans as metro maps in the ConceptDraw PRO diagramming and vector drawing software extended with the Spatial Infographics solution from the area "What is Infographics" of ConceptDraw Solution Park.
Use it in your spatial infographics for visual representation of transport schemes and plans as metro maps in the ConceptDraw PRO diagramming and vector drawing software extended with the Spatial Infographics solution from the area "What is Infographics" of ConceptDraw Solution Park.
Train Railway

Bus Stop

Tramlink

Marina/Ferry Dock

Information Center

Information Center

Airport

Airport

Underground/Subway/Metro

Underground/Subway/Metro

National Rail Train Station

Taxi

Taxi

Parking

Parking

Parking

Parking

Bicycle Parking

Bicycle Parking

Fuel/Gas/Petrol

Fuel/Gas/Petrol

Police

Police

Hospital

Hospital

Wheelchair Access

Wheelchair Access

First Aid

First Aid

Telephone

Telephone

Post Office

Post Office

Landmarks and Museums

Landmarks and Museums

University

University

Shopping/Supermarket

Shopping/Supermarket

Cafe

Cafe

Food and Drinks

Food and Drinks

Man

Woman

Restrooms/Toilets

Restrooms/Toilets

Park

Park

Zoo

Zoo

Hotel

Hotel

Camping

Camping

City

Skyscraper

Building

Ocean

Straight River

Flexible River

Bridge

North Arrow
Viewpoint

Scale

Road line

Road rounded line

Road corner

Road curve 1

Road curve 2

Crossroads

Roundabout

Cloverleaf interchange

Roadway break

Railway line

Railway curve

Railway fork

Standard line with standard station - basic road

Thick line with standard station - basic road

Standard line with rectangular station - basic road

Thick line with rectangular station - basic road

Standard line with standard station - double road

Thick line with standard station - double road

Standard line with rectangular station - double road

Thick line with rectangular station - double road

Standard line with standard station - dotted road

Thick line with standard station - dotted road

Standard line with rectangular station - dotted road

Thick line with rectangular station - dotted road

Interchange Station Vertical

Interchange Station Horizontal

Transfer Station 1

Transfer Station 2

Transfer Station 3

Line Notation

Street direction

Funnel Diagram

In order to make a funnel diagram, the Funnel Diagrams solution can be used while working in the ConceptDraw DIAGRAM diagramming and drawing software. Having the pre-made design elements as well as the examples of funnel diagrams, the Funnel Diagrams solution allows any ConceptDraw DIAGRAM user to make their own unique as well as professionally-looking drawings.
Object-Oriented Design

 Business Process Diagrams
Business Process Flow Diagrams solution extends the ConceptDraw DIAGRAM BPM software with RapidDraw interface, templates, business process diagrams examples and numerous libraries based on the BPMN 1.2 and BPMN 2.0 standards, which give you the possibility to visualize equally easy simple and complex processes, design business models, quickly develop and document in details any business processes on the stages of project’s planning and implementation.
 Power Сircuits
The Power Circuits solution for ConceptDraw DIAGRAM is designed for drawing power electrical circuits, power grids, power generation, transformation, transmission, and distribution systems. It includes a set of samples and a large number of generally accepted electrical circuit symbols that guarantee clarity and simple comprehension of diagrams. The electrical symbols of transformers, motor starters, power stations, electric generators, electrical motors, windings connections, transmission lines, and more equipment are included. Use this solution to successfully create the Power Circuit Diagram of any complexity, display the functional parts of the electrical circuit and connections between them, electrical connections in substations, explain the principles of operation of electrical and power mechanisms, one-phase and three-phase power generation, create specifications of power electrical equipment.
Organization Chart Software: A Comprehensive Guide


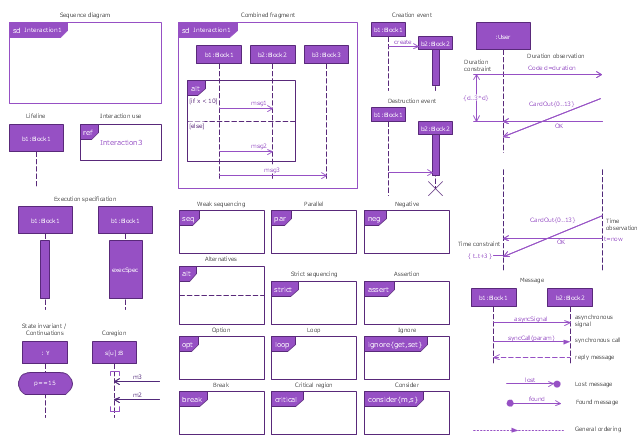
The vector stencils library "Sequence diagram" contains 32 SysML symbols.
Use it to design your sequence diagrams using ConceptDraw PRO diagramming and vector drawing software.
"A sequence diagram shows, as parallel vertical lines (lifelines), different processes or objects that live simultaneously, and, as horizontal arrows, the messages exchanged between them, in the order in which they occur. This allows the specification of simple runtime scenarios in a graphical manner. ...
If the lifeline is that of an object, it demonstrates a role. Leaving the instance name blank can represent anonymous and unnamed instances.
Messages, written with horizontal arrows with the message name written above them, display interaction. Solid arrow heads represent synchronous calls, open arrow heads represent asynchronous messages, and dashed lines represent reply messages. If a caller sends a synchronous message, it must wait until the message is done, such as invoking a subroutine. If a caller sends an asynchronous message, it can continue processing and doesn’t have to wait for a response. Asynchronous calls are present in multithreaded applications and in message-oriented middleware. Activation boxes, or method-call boxes, are opaque rectangles drawn on top of lifelines to represent that processes are being performed in response to the message (ExecutionSpecifications in UML).
Objects calling methods on themselves use messages and add new activation boxes on top of any others to indicate a further level of processing.
When an object is destroyed (removed from memory), an X is drawn on top of the lifeline, and the dashed line ceases to be drawn below it (this is not the case in the first example though). It should be the result of a message, either from the object itself, or another.
A message sent from outside the diagram can be represented by a message originating from a filled-in circle (found message in UML) or from a border of the sequence diagram (gate in UML)." [Sequence diagram. Wikipedia]
The SysML shapes example "Design elements - Sequence diagram" is included in the SysML solution from the Software Development area of ConceptDraw Solution Park.
SysML sequence diagram symbols
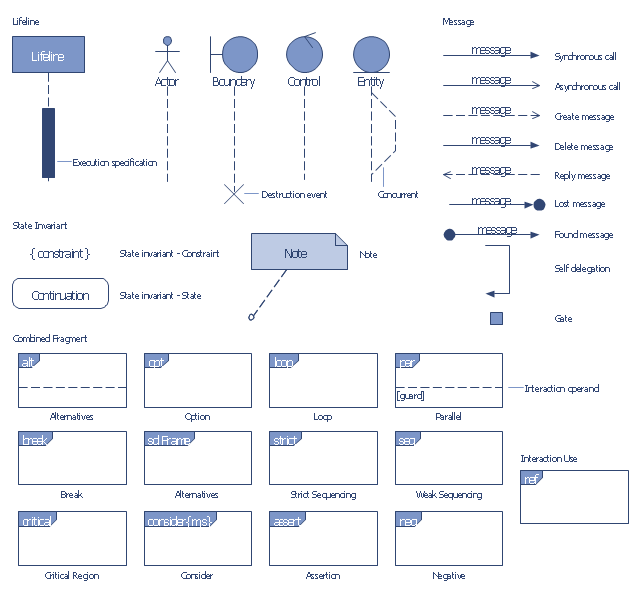
The vector stencils library "Bank UML sequence diagram" contains 34 shapes for drawing UML sequence diagrams.
Use it for object-oriented modeling of your bank information system.
"A sequence diagram shows, as parallel vertical lines (lifelines), different processes or objects that live simultaneously, and, as horizontal arrows, the messages exchanged between them, in the order in which they occur. This allows the specification of simple runtime scenarios in a graphical manner.
Diagram building blocks.
If the lifeline is that of an object, it demonstrates a role. Leaving the instance name blank can represent anonymous and unnamed instances.
Messages, written with horizontal arrows with the message name written above them, display interaction. Solid arrow heads represent synchronous calls, open arrow heads represent asynchronous messages, and dashed lines represent reply messages. ...
Activation boxes, or method-call boxes, are opaque rectangles drawn on top of lifelines to represent that processes are being performed in response to the message (ExecutionSpecifications in UML).
Objects calling methods on themselves use messages and add new activation boxes on top of any others to indicate a further level of processing.
When an object is destroyed (removed from memory), an X is drawn on top of the lifeline, and the dashed line ceases to be drawn below it ...
A message sent from outside the diagram can be represented by a message originating from a filled-in circle (found message in UML) or from a border of the sequence diagram (gate in UML)." [Sequence diagram. Wikipedia]
This example of UML sequence diagram symbols for the ConceptDraw PRO diagramming and vector drawing software is included in the ATM UML Diagrams solution from the Software Development area of ConceptDraw Solution Park.
UML sequence diagram symbols
- Basic Flowchart Symbols and Meaning | ERD Symbols and ...
- ERD Symbols and Meanings | Entity Relationship Diagram Symbols ...
- Design elements | Flow Chart Broken Line Meaning
- Design elements - Management connectors | Dotted Line Connectors
- Design elements | IDEF3 Standard | Flowchart Dotted Line Symbols
- IDEF3 Standard | Dotted Line Meaning In Flow Chart
- How to Draw a Line Chart Quickly | Business Processes Area ...
- How to Draw a Line Chart Quickly | Garrett IA Diagrams with ...
- Basic Flowchart Symbols and Meaning | ERD Symbols and ...
- Basic Flowchart Symbols and Meaning | Flowchart Components ...