This site uses cookies. By continuing to browse the ConceptDraw site you are agreeing to our Use of Site Cookies.

Basic Flowchart Symbols and Meaning

Flowchart Symbols and Meaning - Provides a visual representation of basic flowchart symbols and their proposed use in professional workflow diagram, standard process flow diagram and communicating the structure of a well-developed web site, as well as their correlation in developing on-line instructional projects. See flowchart's symbols by specifics of process flow diagram symbols and workflow diagram symbols.
How to Build a Flowchart

ERD Symbols and Meanings

Crow's foot notation is used in Barker's Notation, Structured Systems Analysis and Design Method (SSADM) and information engineering. Crow's foot diagrams represent entities as boxes, and relationships as lines between the boxes. Different shapes at the ends of these lines represent the cardinality of the relationship.
The Chen's ERD notation is still used and is considered to present a more detailed way of representing entities and relationships.
To create an ERD, software engineers mainly turn to dedicated drawing software, which contain the full notation resources for their specific database design - ERD symbols and meanings. CS Odessa has released an all-inclusive Entity-Relationship Diagram (ERD) solution for their powerful drawing program, ConceptDraw DIAGRAM.
How to Build an Entity Relationship Diagram (ERD)

Competitor Analysis

Competitor analysis is a first and obligatory step in elaboration the proper corporate marketing strategy and creating sustainable competitive advantage. Use powerful opportunities of numerous solutions from ConceptDraw Solution Park for designing illustrative diagrams, charts, matrices which are necessary for effective competitor analysis.

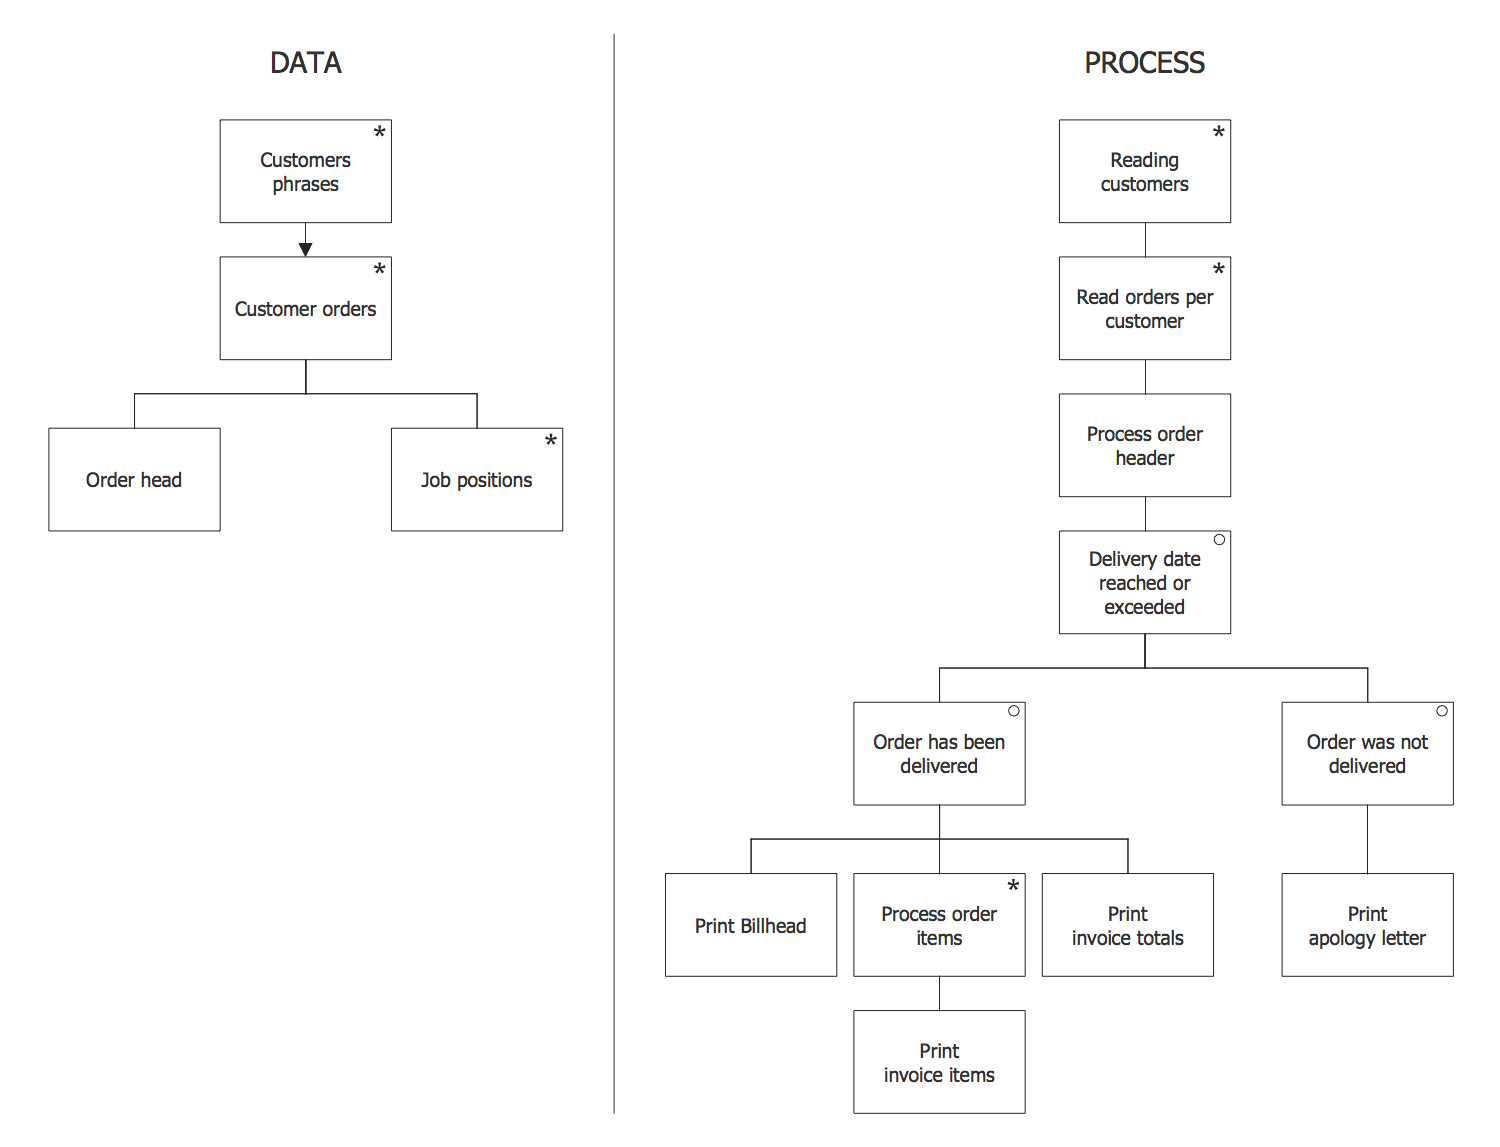
Program Structure Diagram

A visual representation of the configuration system, as well as the internal interfaces among such drawing’s CIs, may be always done with the help of the professional tool, such as the ConceptDraw DIAGRAM diagramming software. The structure diagram may be used for identifying the CIs as well as their associated artifacts. Doing it with the aid of ConceptDraw DIAGRAM as well as its extension (the Jackson Structured Programming (JSP) Diagrams solution) may simplify anyone’s work of making such diagrams.

Pyramid Diagram

Those triangles within any technical analysis are known to be the chart patterns that can be commonly found in the price charts of the financially traded assets, such as stocks, futures, bonds, etc. The pattern is known to be deriving its name from the fact that it is characterized by some contraction in a price range being the converged trend lines, giving it a triangular shape.

process flow diagram, process flow chart Process Flowcharts

process flow diagram, process flow chart
This solution extends ConceptDraw DIAGRAM software with templates, samples, and library of vector shapes for drawing the Process Flowcharts.

Network Topologies

Running your own business or working for some company as IT specialist, one day you definitely face the need of connecting all network and computer devices existing on this enterprise's balance sheet. Especially once this company grows you need more stuff and so elements of network such as laptops, servers, scanners, printers, fax machines, telephones, routers, so you definitely have to make network topology flowchart to arrange it all correctly to connect it with each other. In this case to use ConceptDraw DIAGRAM as a tool to make your topology diagram is the best decision ever! Test how simple it is to use our samples to create your diagrams in a short term! Whether you need to make logical or physical topologies you can always use the service of our software and with help of libraries to design whatever you need. The basic topologies types are: ring, mesh, bus, star, tree or fully connected one, and its examples are there in Solutions waiting for you on this site to use it all. Check it out and enjoy simplicity of using this application right now!
Create Network Topology Diagram

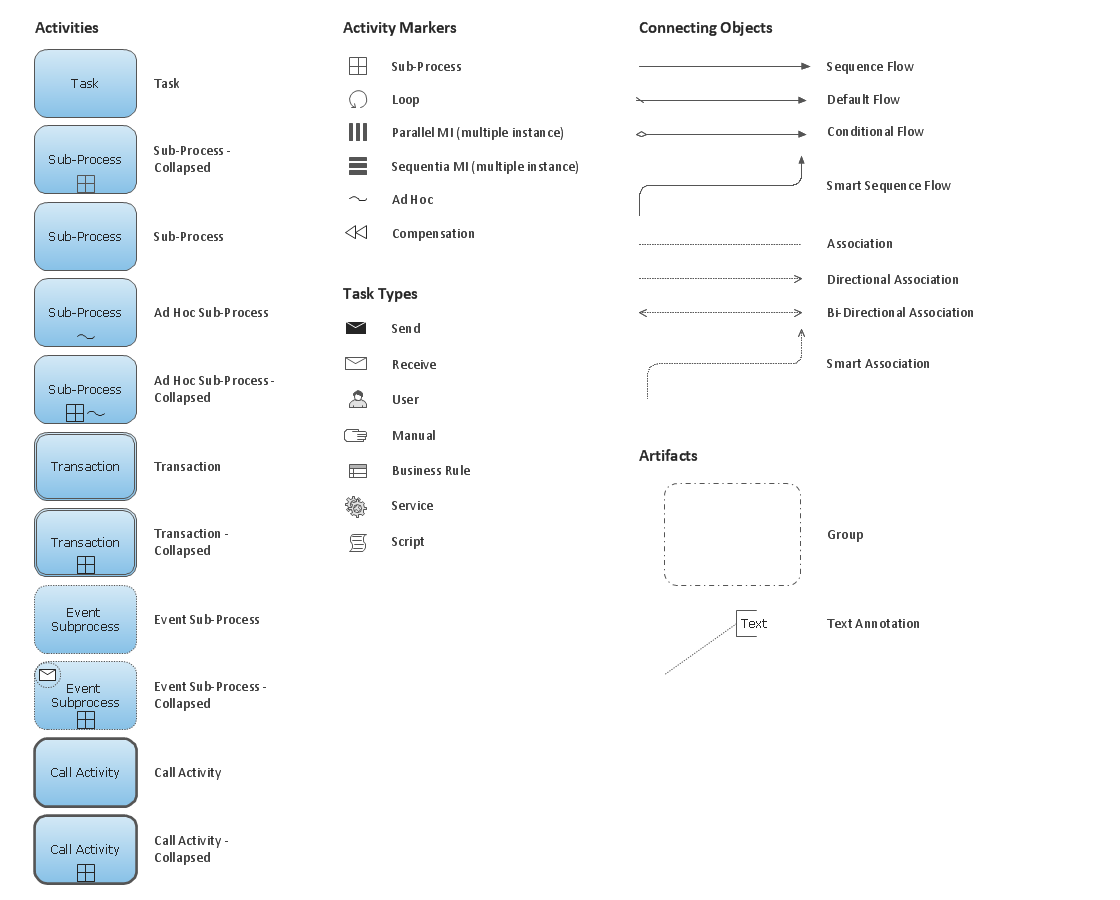
Business Process Elements: Activities

Create professional business process diagrams using ConceptDraw Activities library with 34 objects from BPMN.

How Do Fishbone Diagrams Solve Manufacturing Problems

How do Fishbone diagrams solve manufacturing problems? Fishbone diagrams are successfully used in various fields of industries and manufacturing to analyze the set of possible causes and their effects. Fishbone diagram provides a process to clearly define the “Effect” and then puts you to thinking about the possible causes, based on the categories of common problems in manufacturing.
ConceptDraw DIAGRAM application extended with Fishbone Diagrams solution lets you construct Fishbone diagrams and represent globally recognized standards for manufacturing 6 Ms and 8 Ms.

Human Resource Management

ConceptDraw DIAGRAM diagramming and vector drawing software enhanced with powerful HR Flowcharts Solution from the Management Area of ConceptDraw Solution Park perfectly suits for Human Resource Management.