Made with
ConceptDraw
DIAGRAM 18

Program Structure Diagram

A Structure Chart in organizational theory as well as in the software engineering is known to be a chart used for showing the breakdown of some particular system all the to its lowest manageable levels. Such levels may be used in a structured programming for arranging the program modules into a “tree”. Each of the modules is represented in a way of a box. Such box contains the module's name and the whole tree structure visualizes the relationships between the mentioned modules.

Any structure diagram or chart is widely used as a top-down modular design tool. It is constructed of squares that all represent the different modules in the system. There are also the lines that connect all these modules. The described lines represent the connections as well as the ownership of different activities. The sub-activities may be also represented with the help of the lines same way they are used in the org charts.

In any structured analysis, structure charts are commonly used in order to specify the high-level design of some particular computer program. As a design tool, these diagrams aid the programmer in conquering and dividing some large and complicated software problem. It allows breaking a problem down into small parts so they can become well understood by a human brain.

The process is called “top-down design”. It may be also described as a so-called “functional decomposition”. Many programmers use a structure chart for building a program in a manner that is similar to the way an architect uses a blueprint in terms of building a house. The program structure diagram can be drawn and used in the design stage as a way for both the clients and the software designers to communicate.

A structure diagram depicts the complexity and the size of the system, the number of the readily identifiable modules and functions as well as whether each of such functions is a manageable entity. Unless the functions are manageable entities, they should be broken down into some smaller components.

Any program structure diagram may be also used to diagram some associated elements. Such elements should be able to comprise a thread or a run stream. Being often developed as a hierarchical diagram, such elements may be represented in some other drawing way as well. Any representation must describe the breakdown of the configuration system into subsystems. A complete and accurate structure diagram may be the key to the process of determining the configuration items.

A visual representation of the configuration system, as well as the internal interfaces among such drawing’s CIs, may be always done with the help of the professional tool, such as the ConceptDraw DIAGRAM diagramming software. The structure diagram may be used for identifying the CIs as well as their associated artifacts. Doing it with the aid of ConceptDraw DIAGRAM as well as its extension (the Jackson Structured Programming (JSP) Diagrams solution) may simplify anyone’s work of making such diagrams.

Program Structure Diagram *

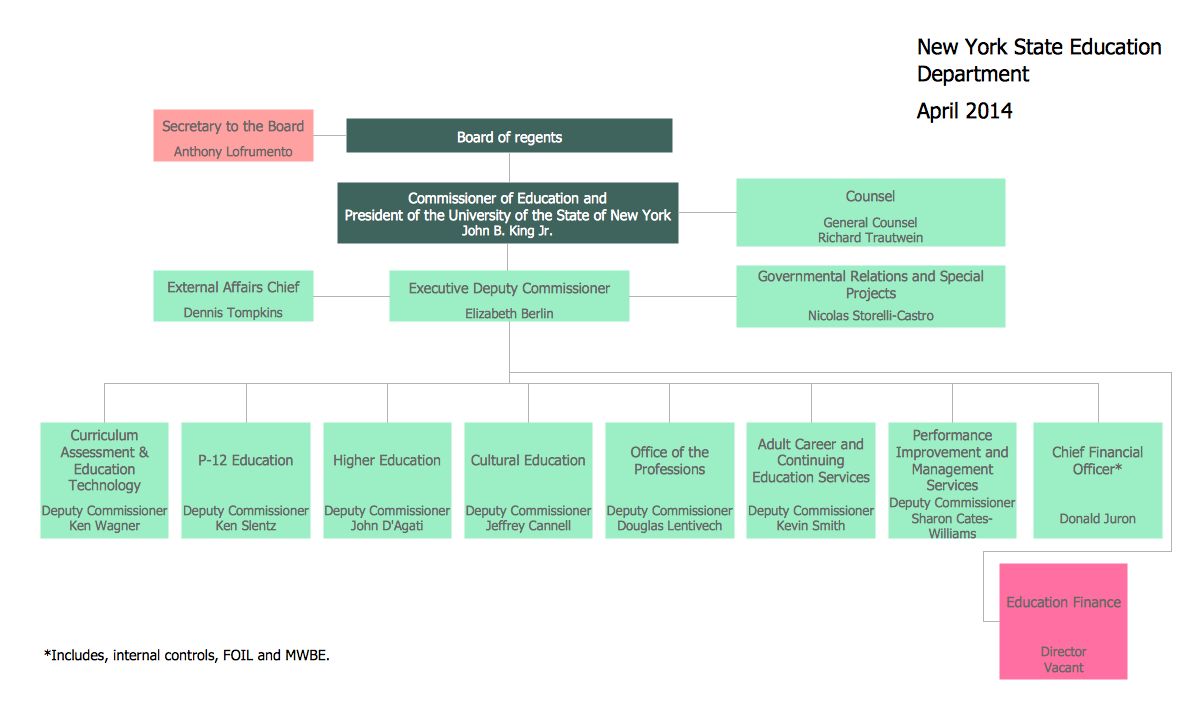
Example 1. Program Structure Diagram

Any structure chart can be developed by, first of all, creating its structure. It is expected to place the root of an upside-down tree. The last-mentioned tree is the one known to be forming the needed program structure diagram. Next, the conceptualization of the main sub-tasks must be performed by the program in order to solve the given problem.

While creating the program structure diagrams, any programmer must be focused on each of the sub-tasks individually. He should conceptualize the way each of the tasks being broken down into even smaller ones. Having the finally broken-down program to a point where the leaves of the “tree” become representing simple methods, they can be coded with only a few program statements.

Usually, first of all, there is a need for checking whether a Structure Diagram has been already developed before. In case it was, any expert needs to review such drawing in order to ensure that it represents the current structure. Unless it does, the updates need to be done to the diagram where needed.

Any data structure in computer science is known as a way of organizing and storing data in a computer. Making this data more efficiently in this way seems to be one of the best options of what to do with it. Different kinds of data structures may be well-known for fitting different applications. Some of them may be highly specialized to some definite, specific tasks. An example may be the B-trees that are particularly well-suited for implementing the databases.

Data structures are known to be the best widely used tool for providing the needed means for managing the large amounts of data in an efficient way. These amounts of data may be internet indexing services and large databases. The efficient data structures may be a key to designing some efficient algorithms to be used in a computer science. Some programming languages and formal design methods may outline the data structures, not the algorithms, being the main thing that helps with organizing in software design. Both retrieving and storing can be carried out on data stored in secondary and in main memory.

Jackson Structured Programming (JSP) Diagram Elements

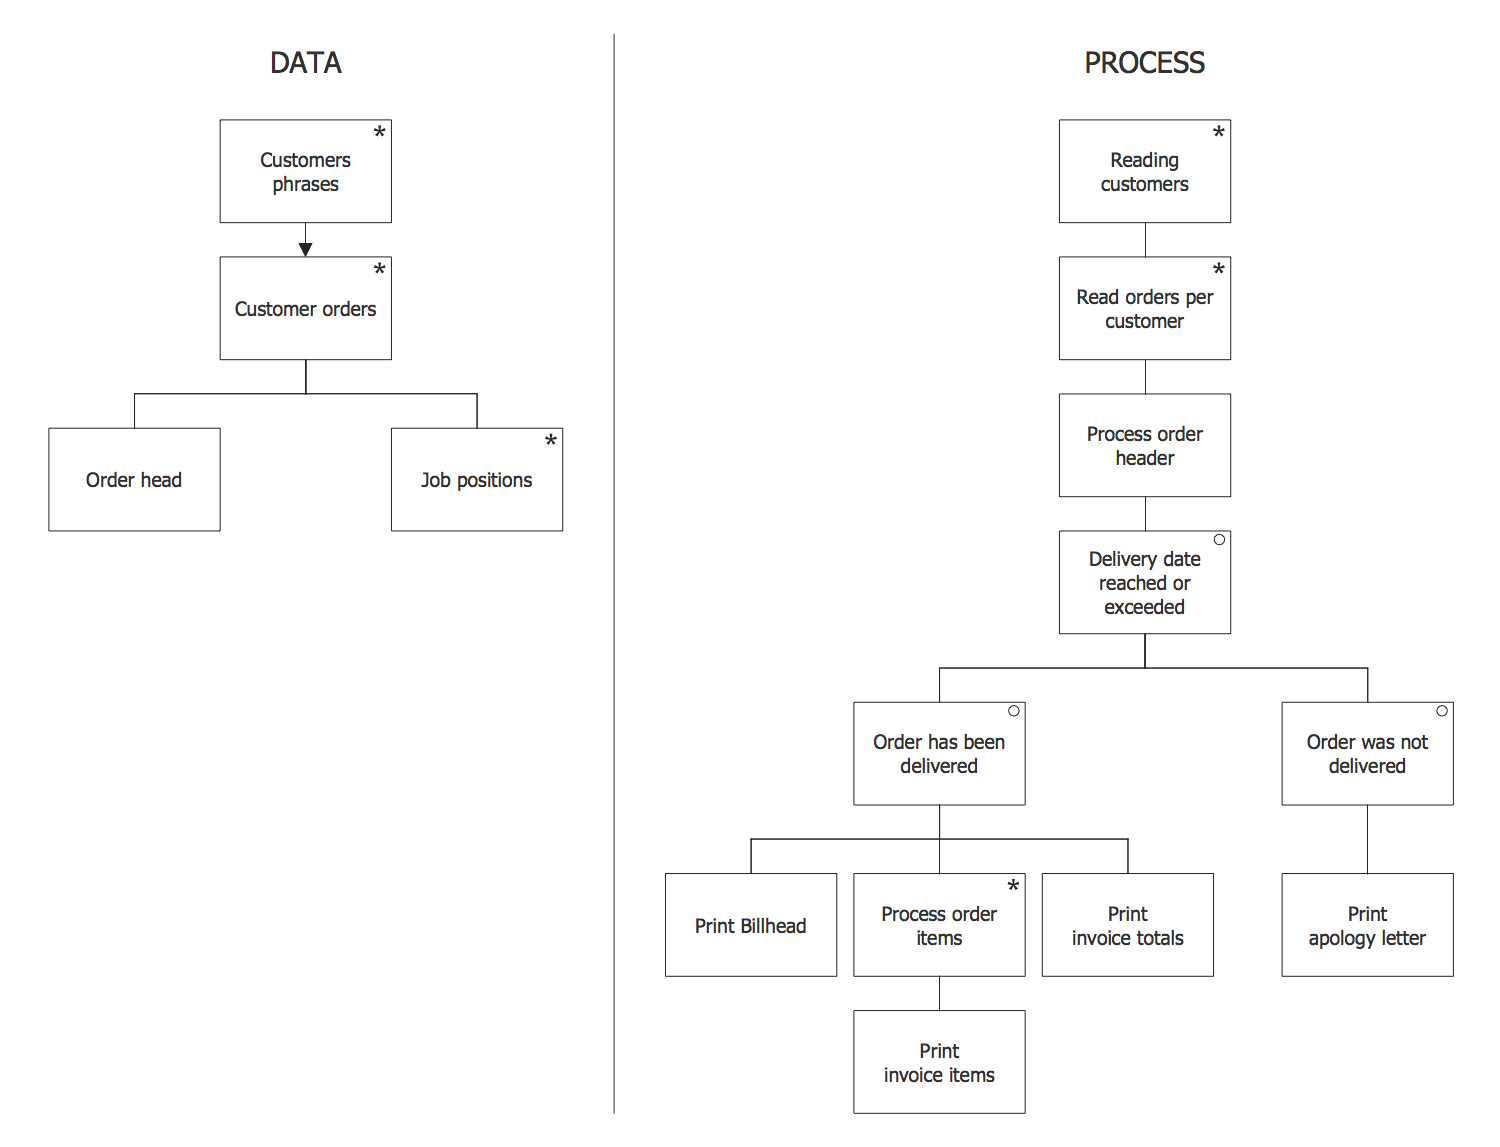
Example 2. Jackson Structured Programming Symbols

The Jackson Structured Programming (JSP) Diagrams solution from ConceptDraw Solution Park provides the stencil library of design elements as well as multiple pre-made templates of the diagrams. They all can be used for quick drawing the needed diagrams of programs. The design objects from this solution may be also used while working in the ConceptDraw DIAGRAM diagramming and vector drawing software.

TEN RELATED HOW TO's:
Infographics can be created with the help of ConceptDraw DIAGRAM diagramming and drawing software same way any other scheme or flowchart can be made: by using the appropriate solution taken from the ConceptDraw STORE application which consists of the needed tools such as the stencil libraries with the design elements that all can be used by the ConceptDraw DIAGRAM users.Information Graphics *
Picture: Information Graphics
Related Solution:
ConceptDraw DIAGRAM is a powerful tool for business and technical diagramming. Software Development area of ConceptDraw Solution Park provides 5 solutions: Data Flow Diagrams, Entity-Relationship Diagram (ERD), Graphic User Interface, IDEFO Diagrams, Rapid UML.Software Diagram Examples and Templates *
Picture: Software Diagram Examples and Templates
Related Solution:
When trying to figure out the nature of the problems occurring within a project, there are many ways to develop such understanding. One of the most common ways to document processes for further improvement is to draw a process flowchart, which depicts the activities of the process arranged in sequential order — this is business process management. ConceptDraw DIAGRAM is business process mapping software with impressive range of productivity features for business process management and classic project management. This business process management software is helpful for many purposes from different payment processes, or manufacturing processes to chemical processes. Business process mapping flowcharts helps clarify the actual workflow of different people engaged in the same process. This samples were made with ConceptDraw DIAGRAM — business process mapping software for flowcharting and used as classic visio alternative because its briefly named "visio for mac" and for windows, this sort of software named the business process management tools. This flowchart diagram shows a process flow of project management. The diagram that is presented here depicts the project life cycle that is basic for the most of project management methods. Breaking a project into phases allows to track it in the proper manner. Through separation on phases, the total workflow of a project is divided into some foreseeable components, thus making it easier to follow the project status. A project life cycle commonly includes: initiation, definition, design, development and implementation phases. Distinguished method to show parallel and interdependent processes, as well as project life cycle relationships. A flowchart diagram is often used as visual guide to project. For instance, it used by marketing project management software for visualizing stages of marketing activities or as project management workflow tools. Created with ConceptDraw DIAGRAM — business process mapping software which is flowcharting visio alternative or shortly its visio for mac, this sort of software platform often named the business process management tools.Process Flowchart
Picture: Process Flowchart: A Step-by-Step Comprehensive Guide
Related Solution:
Use Case Diagrams technology. IDEF4 standard implies not only graphical presentation but the additional information about diagrams of heredity, methods systematization and types which are contained in specifications.IDEF4 Standard *
Picture: IDEF4 Standard
The ConceptDraw Flowchart component includes a set of samples and templates. This geathered as flowchart maker toolbox which focused on drawing flowcharts of any industry standards.Flowchart Components
Picture: Flowchart Components
Related Solution:
This method of problem analysis is widely used in IT, manufacture industries and chemical engineering. If you want to take a fresh look on your problem, you can draw a fishbone diagram with ConceptDraw DIAGRAM software, which supports both MAC OS and Windows. You can see and download fishbone diagram samples and templates in ConceptDraw Solution Park. This Fishbone (Ishikawa) diagram can be applied as template for performing the cause and effect analysis of a service industry problems. It can help to determine factors causing problems. Causes in this diagram are categorized according to the 4S’s principle that means Surroundings, Suppliers, Systems and Skills. Grouping causes allows to reveal main interactions between different events. This diagram was made using ConceptDraw Fishbone diagrams solution. It can help to reveal the causes effected a complicated issue. Of course it can be used together with other methods of approaching to the problem solving.Draw Fishbone Diagram on MAC Software *
Picture: Draw Fishbone Diagram on MAC Software
Related Solution:
Those triangles within any technical analysis are known to be the chart patterns that can be commonly found in the price charts of the financially traded assets, such as stocks, futures, bonds, etc. The pattern is known to be deriving its name from the fact that it is characterized by some contraction in a price range being the converged trend lines, giving it a triangular shape.Pyramid Diagram *
Picture: Pyramid Diagram
Related Solution:
Structured-systems analysis and design method uses data flow diagrams to represent the process of data flowing through a system. Talking about this might be useless without a proper example of DFD for online store (Data Flow Diagram). This DFD example shows all the distinctness that a diagram can bring into a scattered data structure. Data flow diagrams are used to show how data is processed within some business processes. Making DFD is a common practice for business process modeling and analysis. This diagram represents the online store business flow. It describes inputs and outputs within online selling process and depicts the interactions between its participants. This DF diagram can be used by system analysts to create an overview of a business, to study and discover its inherent strengths and weak points.Example of DFD for Online Store
Picture: Example of DFD for Online Store (Data Flow Diagram)
Related Solution:
Digital electronics or digital (electronic) circuits are electronics that handle digital signals – discrete bands of analog levels – rather than by continuous ranges (as used in analogue electronics). All levels within a band of values represent the same numeric value. Because of this discretization, relatively small changes to the analog signal levels due to manufacturing tolerance, signal attenuation or parasitic noise do not leave the discrete envelope, and as a result are ignored by signal state sensing circuitry. 26 libraries of the Electrical Engineering Solution of ConceptDraw DIAGRAM make your electrical diagramming simple, efficient, and effective. You can simply and quickly drop the ready-to-use objects from libraries into your document to create the electrical diagram.Electrical Symbols — Analog and Digital Logic *
Picture: Electrical Symbols — Analog and Digital Logic
Related Solution:
Creation of various types of Integration DEFinition (IDEF) diagrams - IDEF0, IDEF1X, IDEF2, IDEF3 and many other is a sufficiently complex process that requires powerful automated tools. ConceptDraw DIAGRAM diagramming and vector drawing software offers you such tool - IDEF Business Process Diagrams solution from the Business Processes area of ConceptDraw Solution Park.Integration Definition *
Picture: Integration Definition
Related Solution:
ConceptDraw
DIAGRAM 18