Process Flowchart


How to draw Metro Map style infographics? Moscow, New York, Los Angeles, London

Process Flow Diagram

This work flow chart sample was redesigned from the picture "Weather Forecast" from the article "Simulation Workflows".
[iaas.uni-stuttgart.de/ forschung/ projects/ simtech/ sim-workflows.php]
"(1) The weather is predicted for a particular geological area. Hence, the workflow is fed with a model of the geophysical environment of ground, air and water for a requested area.
(2) Over a specified period of time (e.g. 6 hours) several different variables are measured and observed. Ground stations, ships, airplanes, weather balloons, satellites and buoys measure the air pressure, air/ water temperature, wind velocity, air humidity, vertical temperature profiles, cloud velocity, rain fall, and more.
(3) This data needs to be collected from the different sources and stored for later access.
(4) The collected data is analyzed and transformed into a common format (e.g. Fahrenheit to Celsius scale). The normalized values are used to create the current state of the atmosphere.
(5) Then, a numerical weather forecast is made based on mathematical-physical models (e.g. GFS - Global Forecast System, UKMO - United Kingdom MOdel, GME - global model of Deutscher Wetterdienst). The environmental area needs to be discretized beforehand using grid cells. The physical parameters measured in Step 2 are exposed in 3D space as timely function. This leads to a system of partial differential equations reflecting the physical relations that is solved numerically.
(6) The results of the numerical models are complemented with a statistical interpretation (e.g. with MOS - Model-Output-Statistics). That means the forecast result of the numerical models is compared to statistical weather data. Known forecast failures are corrected.
(7) The numerical post-processing is done with DMO (Direct Model Output): the numerical results are interpolated for specific geological locations.
(8) Additionally, a statistical post-processing step removes failures of measuring devices (e.g. using KALMAN filters).
(9) The statistical interpretation and the numerical results are then observed and interpreted by meteorologists based on their subjective experiences.
(10) Finally, the weather forecast is visualized and presented to interested people." [iaas.uni-stuttgart.de/ forschung/ projects/ simtech/ sim-workflows.php]
The example "Workflow diagram - Weather forecast" was drawn using the ConceptDraw PRO diagramming and vector drawing software extended with the Workflow Diagrams solution from the Business Processes area of ConceptDraw Solution Park.
Work flow chart

Cross-Functional Flowchart


"There are two definitions for wireless LAN roaming:
Internal Roaming (1): The Mobile Station (MS) moves from one access point (AP) to another AP within a home network because the signal strength is too weak. An authentication server (RADIUS) performs the re-authentication of MS via 802.1x (e.g. with PEAP). The billing of QoS is in the home network. A Mobile Station roaming from one access point to another often interrupts the flow of data among the Mobile Station and an application connected to the network. The Mobile Station, for instance, periodically monitors the presence of alternative access points (ones that will provide a better connection). At some point, based on proprietary mechanisms, the Mobile Station decides to re-associate with an access point having a stronger wireless signal. The Mobile Station, however, may lose a connection with an access point before associating with another access point. In order to provide reliable connections with applications, the Mobile Station must generally include software that provides session persistence.
External Roaming (2): The MS (client) moves into a WLAN of another Wireless Internet Service Provider (WISP) and takes their services (Hotspot). The user can independently of his home network use another foreign network, if this is open for visitors. There must be special authentication and billing systems for mobile services in a foreign network." [Wireless LAN. Wikipedia]
This Cisco roaming wireless local area network diagram example was created using the ConceptDraw PRO diagramming and vector drawing software extended with the Cisco Network Diagrams solution from the Computer and Networks area of ConceptDraw Solution Park.
WLAN diagram

Used Solutions
Workflow Diagram Software

Workflow Diagram

Visio Files and ConceptDraw

UML 2 4 Process Flow Diagram

SysML Diagram

Best Vector Drawing Application for Mac OS X

IDEF3 Standard

The vector stencils library "HVAC control equipment" contains 48 HVAC symbols. Use it for drawing HVAC systems diagrams, heating, ventilation, air conditioning, refrigeration, automated building control, and environmental control design building plans and equipment layouts. The symbols example "HVAC control equipment - Vector stencils library" was created using the ConceptDraw PRO diagramming and vector drawing software extended with the HVAC Plans solution from the Building Plans area of ConceptDraw Solution Park.
Duct, sgl line
Duct, dbl line

Return duct, sgl line

Return duct, dbl line

Supply duct, sgl line

Supply duct, dbl line

Return duct 2, sgl line

Return duct 2, dbl line

Supply duct extension, sgl line

Supply duct extension, dbl line

Return duct extension, sgl line

Return duct extension, dbl line

2-fan section, sgl line

2-fan section, dbl line

3-fan section, sgl line

3-fan section, dbl line

4-fan section, sgl line

4-fan section, dbl line

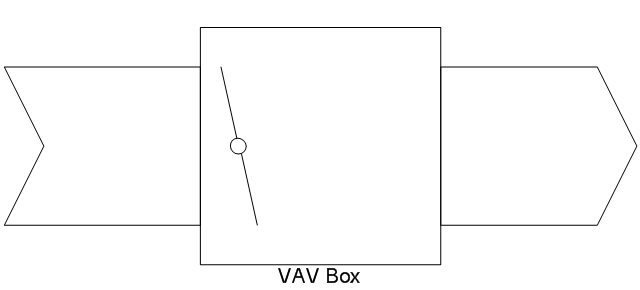
VAV box
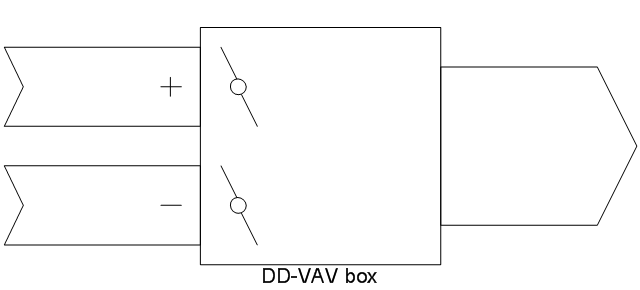
DD-VAV box
Fan coil housing

Unit heater

Centrifugal fan

Propeller fan

Vane axial fan

Damper

Filter

Air flow station

Humidifier

Htg/clg coil
Valve

Water flow meter

Pump


Cooling tower
Converter

Heat exchanger
Boiler
Equipment

Starter

VSD

Side to bottom pipe

Side to bottom pipe, arrow
Side to side pipe

Side to side pipe, arrow
Top to bottom pipe

Top to bottom pipe, arrow
Pipe flow arrow
The Building Blocks Used in EPC Diagrams
")
- Process Flow Diagram Crude Flow Station
- Process Flowchart | Instrumentation Diagram For A Flow Station ...
- Cross-Functional Flowchart | Schematic Diagram Of Oil Flow Station
- Flow Diagram Of Weather Station
- Bubble Diagram Showing The Flow In The Railway Station
- Roaming wireless local area network diagram | Data Flow Diagram ...
- Process Flow Diagram | Engineering | Process Flow Chart | Flow ...
- Basic Flowchart Symbols and Meaning | Flow Chart Symbols ...
- Piping and Instrumentation Diagram Software | Process Flow ...
- Line Diagram Of Flow Control Valve
- Process Flowchart | Design elements - HVAC control equipment ...
- Data Flow Diagram Symbols. DFD Library | Basic Flowchart ...
- Crude oil distillation unit - PFD | Process flow diagram (PFD ...
- Process Flow Diagram Symbols | Design elements - HVAC control ...
- Online Car Parking Data Flow Diagram
- Plant Layout Plans | Design elements - Stations | Electrical Drawing ...
- Telecommunication Network Diagrams | Design elements ...
- HVAC Plans | How to Create a HVAC Plan | Block diagram ...
- Functional Flow Block Diagram
- Process Flowchart | Process Flow Diagram Symbols | Probability ...