EPC (Event-driven Process Chain) Flowcharts
 Flowcharts *")
Flowchart

Flowchart Components

UML Use Case Diagram Example. Registration System

The Best Flowchart Software Available


Business process Flow Chart — Event-Driven Process chain (EPC) diagrams
 diagrams *")
Flowchart Marketing Process. Flowchart Examples

Flowchart on Bank. Flowchart Examples


HelpDesk
Flowchart Software Free Download

Data Flow Diagram Symbols. DFD Library

Formalization and Verification of Event-driven Process chain

Taxi Service Data Flow Diagram DFD Example

Process Modelling using Event-driven Process chain

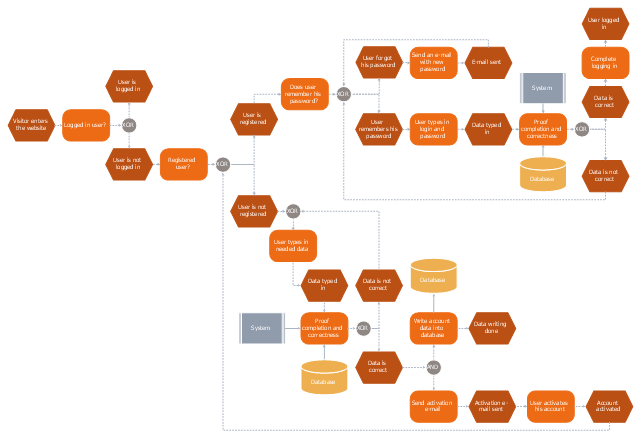
This computer security EPC diagram sample depicts the login and registration processing flow.
"In computer security, a login or logon refers to the credentials required to obtain access to a computer system or other restricted area. Logging in or on and signing in or on is the process by which individual access to a computer system is controlled by identifying and authenticating the user through the credentials presented by the user.
Once a user has logged in, they can then log out or log off when access is no longer needed. To log out is to close off one's access to a computer system after having previously logged in." [Login. Wikipedia]
The event-driven process chain (EPC) flowchart example "Login and registration processing" was created using the ConceptDraw PRO diagramming and vector drawing software extended with the Event-driven Process Chain Diagrams solution from the Business Processes area of ConceptDraw Solution Park.
EPC flowchart
UML 2 4 Process Flow Diagram

How to Help Customers be More Productive

The Best Tool for Business Process Modeling

This flowchart example was created on the base of land sales process diagram from the Property management webpage of the VicRoads website.
[www.vicroads.vic.gov.au/ planning-and-projects/ property-services/ property-management]
"VicRoads or the Roads Corporation of Victoria is a statutory corporation which is the state road and traffic authority in the state of Victoria, Australia. It is responsible for maintenance and construction of the state arterial road network, as well as driver licensing and vehicle registration. VicRoads has broad responsibility for road safety policy and research. It is also responsible for regulating the accident towing industry in Victoria." [VicRoads. Wikipedia]
"Sales Process.
Once it has been established with the relevant VicRoads Regions/ Projects and other business areas that properties are identified as surplus to VicRoads’ operational needs, they are incorporated in the VicRoads annual sales program.
Following approval: relevant VicRoads Regional Manager and the VicRoads Chief Executive (and in some circumstances Minster for Public Transport and Roads) must approve all land deemed surplus and available for disposal.
The method of sale is then determined and consultant advice is sought:
(1) Planning.
(2) Valuer General Victoria (Valuer General’s office must provide a valuation for all sales).
(3) Government Land Monitor (Land Monitor approval is sought if the value exceeds $750,000).
(4) Environmental.
(5) Local Council." [www.vicroads.vic.gov.au/ planning-and-projects/ property-services/ property-management]
The example "Land sales process flowchart" was created using the ConceptDraw PRO diagramming and vector drawing software extended with the Sales Flowcharts solution from the Marketing area of ConceptDraw Solution Park.
Sales process chart

Form Maker

EPC

- Flow Chart For Registration Form
- Registration Flow Chart Example
- Login and registration processing | Login and registration ...
- Sample Flowchart For Registration Process
- Process Flowchart | UML Use Case Diagram Example. Registration ...
- Login and registration processing | Flowchart | Basic Flowchart ...
- Civil Registration System Flowchart
- Flowchart | Business process Flow Chart — Event-Driven Process ...
- Simple Flow Chart For Registration
- Flowchart | UML Use Case Diagram Example. Registration System ...
- Flowchart | UML Use Case Diagram Example Registration System ...
- Process Flowchart | UML Use Case Diagram Example Registration ...
- UML Use Case Diagram Example. Registration System | Flowchart ...
- UML Use Case Diagram Example Registration System | Area Charts ...
- UML Use Case Diagram Example Registration System | Flow chart ...
- Accounting Flowcharts | Activity Diagram Student Registration System
- Data Flow Diagram For Civil Registration System
- Accounting Flowcharts | Class Diagram Example For Student ...
- Data Flow Diagram For Student Registration System
- Taxi Service Data Flow Diagram DFD Example | UML Use Case ...