Example 1. EPC Diagram in ConceptDraw DIAGRAM /p>
Event-driven Process Chain Diagrams EPC Solution offers a set of predesigned templates and samples. You can choose any desired EPC diagram sample from the offered in ConceptDraw STORE that meets your requirements and change it for your needs.

Example 2. Event-driven Process Chain Diagrams EPC Solution in ConceptDraw STORE
Use also the predesigned vector objects from the EPC Diagrams library to design your own EPC diagrams from the beginning, or when you fill the ready template or change sample.

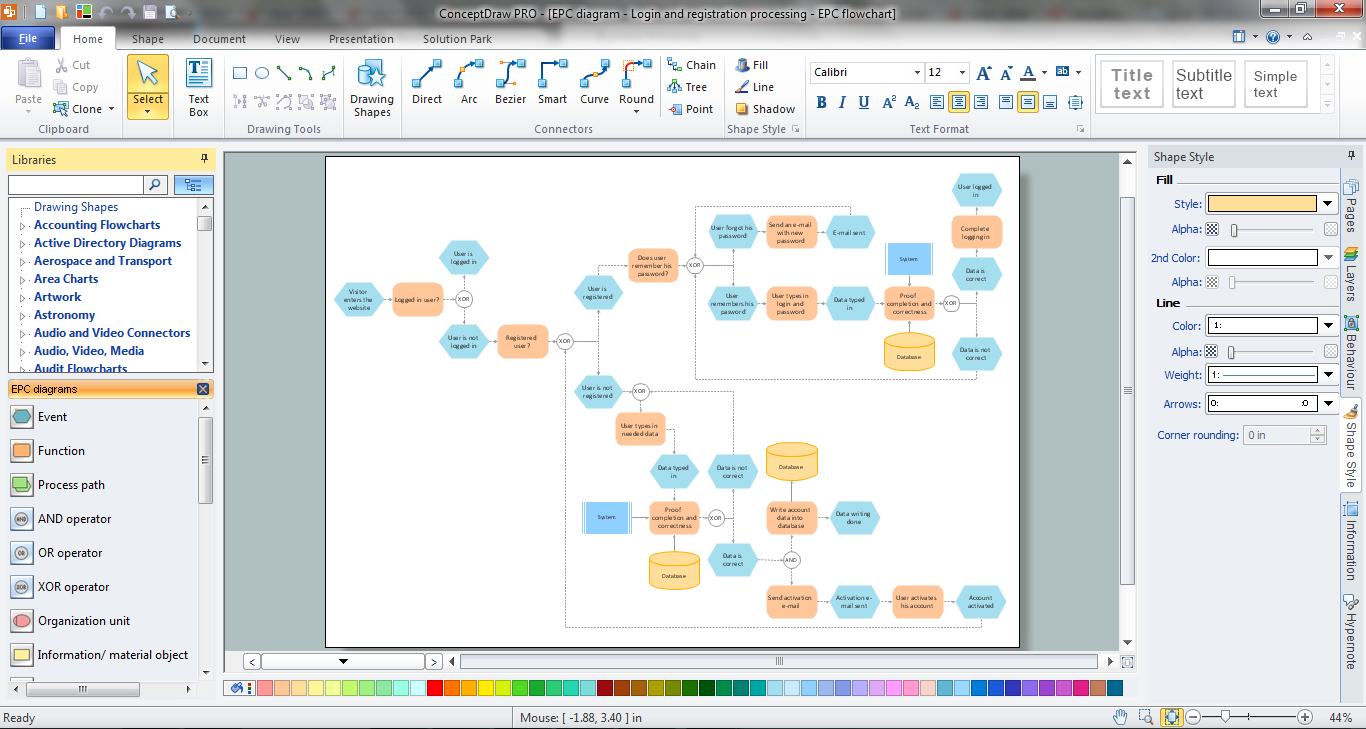
Example 3. EPC Diagram - Login and Registration Processing
This sample was created in ConceptDraw DIAGRAM using the predesigned objects from the Event-driven Process Chain Diagrams EPC Solution. This EPC diagram shows in details all steps of a login and registration processing. An experienced user spent 20 minutes creating this sample.
All source documents are vector graphic documents. They are available for reviewing, modifying, or converting to a variety of formats (PDF file, MS PowerPoint, MS Visio, and many other graphic formats) from the ConceptDraw STORE. The Event-driven Process Chain Diagrams EPC Solution is available for all ConceptDraw DIAGRAM or later users.
EIGHT RELATED HOW TO's:
Event-Driven Process chain Diagrams for improvement throughout an organisation.
ConceptDraw DIAGRAM - software that reduces the time needed to create a business process model.
Picture: Modelling Concepts for Business Engineering - EPC
Related Solution:
If you need to describe some process, diagramming is a perfect tool for almost any imaginable purpose. The set of the most commonly used flow charts symbols is quite wide and includes symbols for operations, processes, data inputs and outputs. You can see the full list of all the symbols used for flowcharting in Flowcharts solution from Diagrams area in ConceptDraw Solution Park.
A flow chart is often used for visual representation of a sequential process flow. The flowchart approach to any process is to divide it into some sequential actions. What makes a flow chart so popular and clear to make out is the set of standard flowchart symbols that has the same reading independently from processes described with their applying. The current drawing represents the vector library containing the pack of standard flowchart symbols. This library is supplied with ConceptDraw Flowcharts solution.
Picture: Flow Chart Symbols
Related Solution:
Event-Driven Process Chain Diagrams for improvement throughout an organisation.
ConceptDraw DIAGRAM - software that reduces the time needed to create a business process model.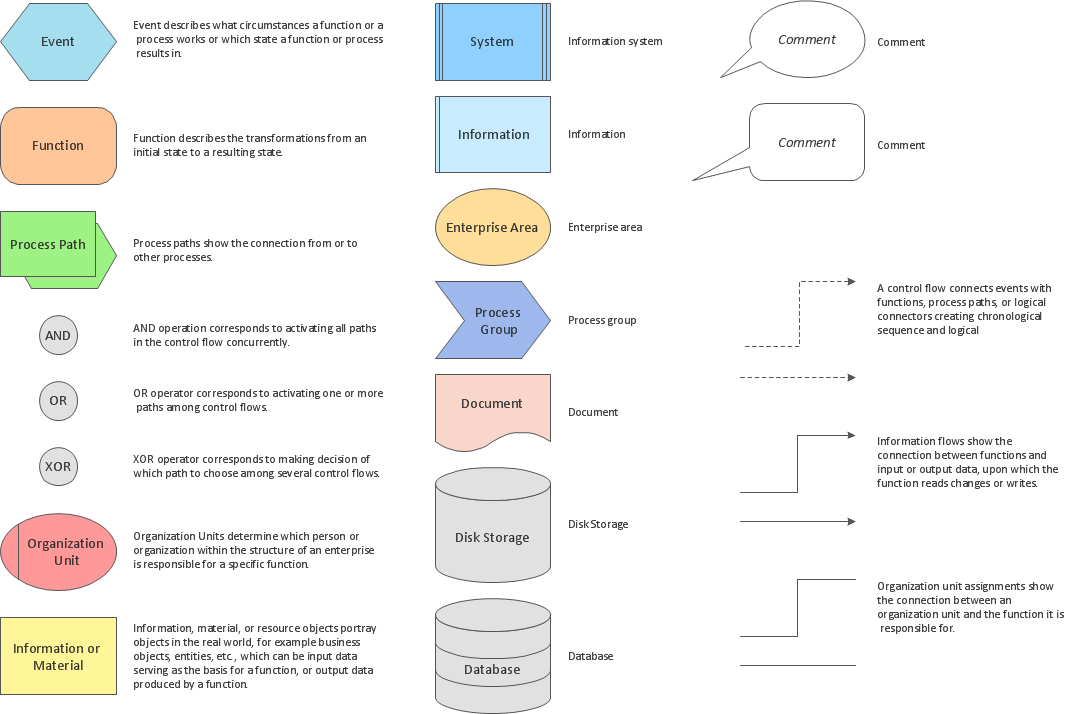
Picture: Different Segments of An EPC
Related Solution:
Event-Driven Process Chain flowcharts for improvement throughout an organisation.
ConceptDraw DIAGRAM is a software for making EPC flowcharts to provide business process modelling. Its excellent business process improvement tools.
Picture: An Event-driven Process Chain (EPC) - flowchart used for business process modelling
Related Solution:
What is a EPC diagram and how design it quick and easy? The Event-driven Process Chain (EPC) is a type of flowchart which is widely used for modeling and analyzing the business processes. It's incredibly convenient to use the EPC Solutions for designing professional looking EPC diagrams. ConceptDraw DIAGRAM diagramming and vector drawing software offers the Event-driven Process Chain Diagrams EPC solution from the Business Processes Area.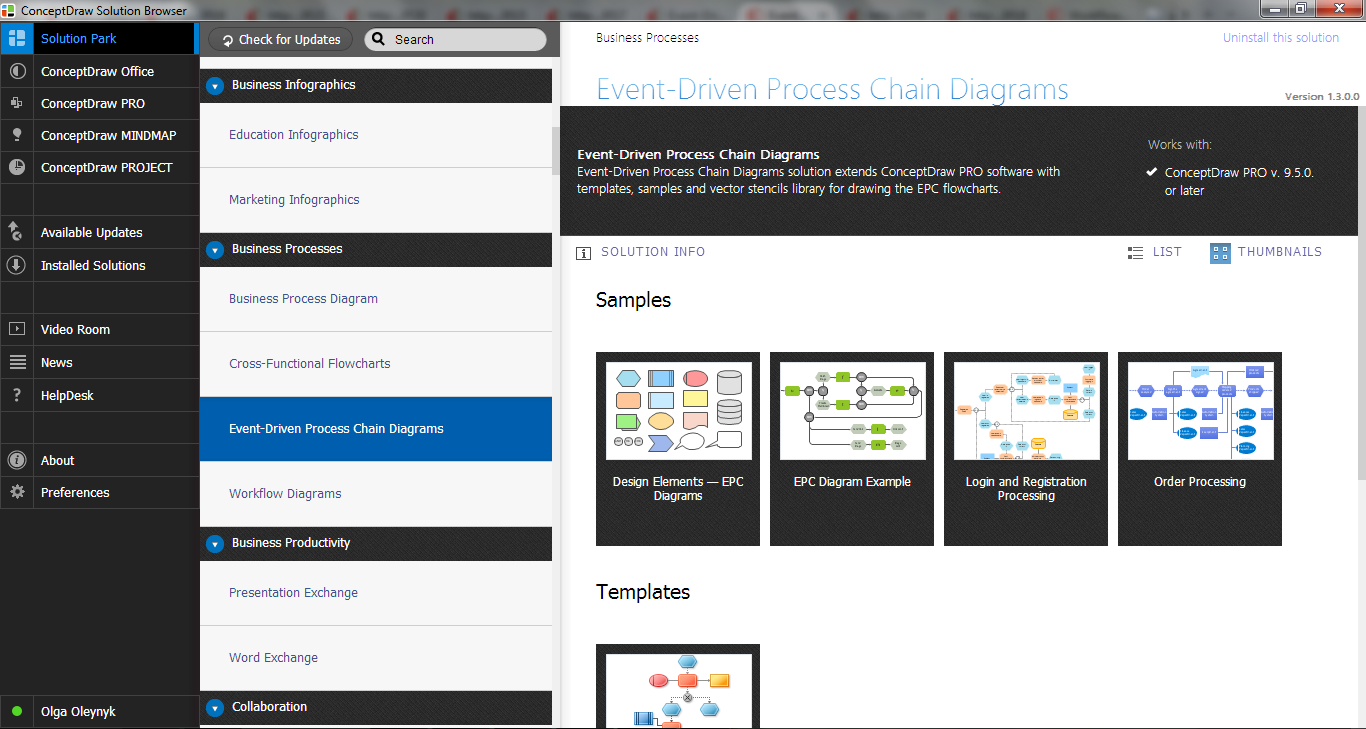
Picture: EPC Solutions
Related Solution:
The Accounting flowchart shows how information flows from source documents through the accounting records. The are based on the accounting procedures or processes.
Flowcharts are used to represent accounting information in a system. There are special symbols which are used to create accounting flowcharts. Try conceptdraw flowcharting set of symbols to draw a professional charts.
Picture: Why Flowchart Important to Accounting Information System?
Related Solution:
Timeline is a type of diagram which illustrates the series of events in a chronological order on a linear timescale. How to make a timeline? It is convenient to use a modern powerful software. ConceptDraw DIAGRAM diagramming and vector drawing software extended with Timeline Diagrams solution from the Management area is exactly what you need.
Picture: How to Make a Timeline
Related Solution:
Use the standardized GHS Hazard pictograms to create 🔸 professional-looking chemical safety infographics and Hazard diagrams to provide reliable information about ✔️ potential dangers, ✔️ dangerous chemical substances and hazardous materials, ✔️ potential risks, ✔️ safety rules and requirements, ✔️ ways to identify hazards and mitigate risks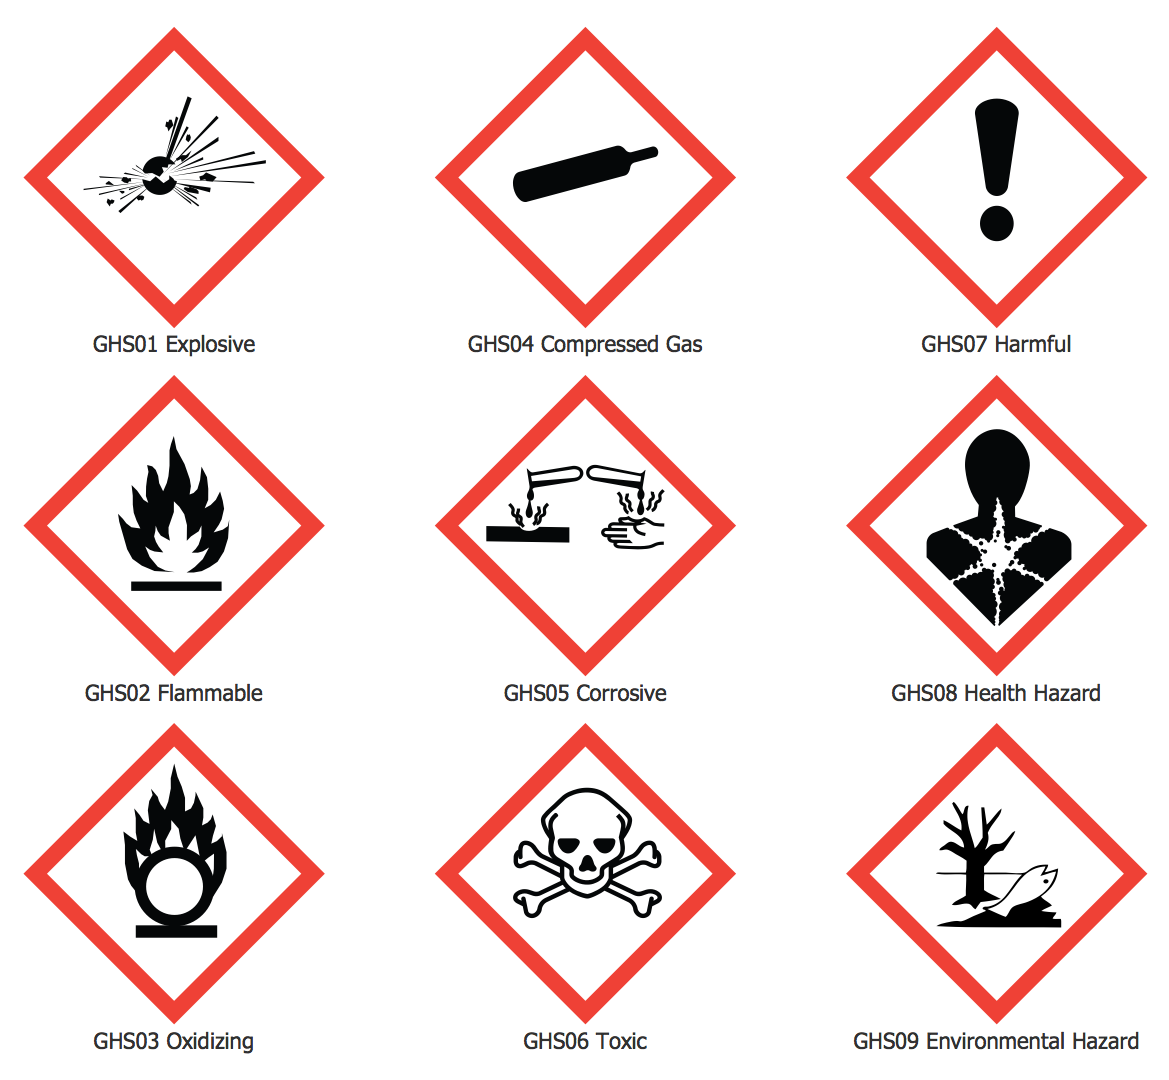
Picture: Hazard Pictograms
Related Solution:

