Local area network (LAN). Computer and Network Examples
A local area network (LAN) is a devices network that connect with each other in the scope of a home, school, laboratory, or office. Usually, a LAN comprise computers and peripheral devices linked to a local domain server. All network appliances can use a shared printers or disk storage. A local area network serve for many hundreds of users. Typically, LAN includes many wires and cables that demand a previously designed network diagram. They are used by IT professionals to visually document the LANs physical structure and arrangement.ConceptDraw - Perfect Network Diagramming Software with examples of LAN Diagrams. ConceptDraw Network Diagram is ideal for network engineers and network designers who need to draw Local Area Network diagrams.
Flowchart Components
The ConceptDraw Flowchart component includes a set of samples and templates. This geathered as flowchart maker toolbox which focused on drawing flowcharts of any industry standards.Network Security Model
Creation of well thought-out network security model will effectively help you in realization your network's security. ConceptDraw DIAGRAM diagramming and vector drawing software extended with Network Security Diagrams Solution from the Computer and Networks Area of ConceptDraw Solution Park lets fast and easy design all variety of network security models: Open network security model, Closed network security model, Restrictive network access model.Organizational Structure Total Quality Management
The Total Quality Management Diagram solution helps you and your organization visualize business and industrial processes. Create Total Quality Management diagrams for business process with ConceptDraw software.Metropolitan area networks (MAN). Computer and Network Examples
Metropolitan Area Network combines local networks located within a city, and is based on high data rate compounds, implemented on the basis of fiber channels and other digital data transmission channels. Now, with the increasing number of network communities, wireless local area networks based on 802.11b standard are combined into a wireless metropolitan area network consisting of affordable antenna systems and consumer-grade wireless equipment using 802.11a and 802.11b standards.Cloud Computing Architecture Diagrams
For documenting the Cloud Computing Architecture with a goal to facilitate the communication between stakeholders are successfully used the Cloud Computing Architecture diagrams. It is convenient and easy to draw various Cloud Computing Architecture diagrams in ConceptDraw DIAGRAM software with help of tools of the Cloud Computing Diagrams Solution from the Computer and Networks Area of ConceptDraw Solution Park.UML Class Diagram Notation
When it comes to system construction, a class diagram is the most widely used diagram. UML Class Diagrams is a type of static structure diagram that is used for general conceptual modeling of the systematics of the application. Such a diagram would illustrate the object-oriented view of a system. The object orientation of a system is indicated by a class diagram. It describes the structure of a system by showing the general issues,classes of a system, attributes, operations, interfaces, inheritance, and the relationships between them.Pyramid Diagram
The DIKW Pyramid refers loosely to a class of models for representing purported structural and/or functional relationships between data, information, knowledge, and wisdom.Entity Relationship Diagram Software Engineering
Entity Relationship Diagram (aka ERD, ER Diagram, E-R Diagram) is a well-tried software engineering tool for data modeling, system design and illustrating the logical structure of databases.Professional ERD drawing is an essential software engineering method for database modeling. ConceptDraw DIAGRAM as a powerful Entity Relationship Diagram Software Engineering offers the tools of Entity-Relationship Diagram (ERD) solution from Software Development area of ConceptDraw Solution Park.
UML Use Case Diagram Example. Registration System
The use case diagram (behavior scenarios, precedents) is the initial conceptual representation of the system during its design and development. This diagram consists of actors, use cases and relationships between them. When constructing a diagram, common notation elements can also be used: notes and extension mechanisms.This sample was created in ConceptDraw DIAGRAM diagramming and vector drawing software using the UML Use Case Diagram library of the Rapid UML Solution from the Software Development area of ConceptDraw Solution Park.
This sample shows the types of user’s interactions with the system and is used at the registration and working with the database system.
Circle Diagrams
The Circle Diagrams are the diagrams which represent the central element surrounded by other items in a circle. This type of diagram is very popular and widely used in marketing and management, for process modeling, market, resource, time and cost analysis, for visualization causes and effects. If you dream to design the Circle Diagrams quick and easy – the ConceptDraw DIAGRAM software extended with Circle-Spoke Diagrams Solution from the "Diagrams" Area is exactly what you need.Network Security Diagram
ConceptDraw DIAGRAM diagramming and vector drawing software enhanced with Network Security Diagrams Solution from the Computer and Networks Area of ConceptDraw Solution Park is the best for effective design professional, colorful and attractive Network Security Diagram of any complexity and degree of detailing.Active Directory Diagrams
Active Directory Diagrams solution significantly extends the capabilities of ConceptDraw DIAGRAM software with special Active Directory samples, convenient template and libraries of Active Directory vector stencils, common icons of sites and services, icons of LDPA elements, which were developed to help you in planning and modelling network structures and network topologies, in designing excellently looking Active Directory diagrams, Active Directory Structure diagrams, and Active Directory Services diagram, which are perfect way to visualize detailed structures of Microsoft Windows networks, Active Directory Domain topology, Active Directory Site topology, Organizational Units (OU), and Exchange Server organization.
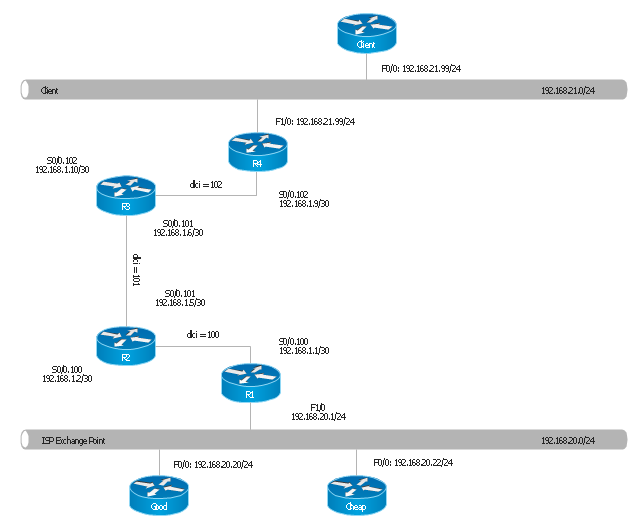
"Logical topology, or signal topology, is the arrangement of devices on a computer network and how they communicate with one another. How devices are connected to the network through the actual cables that transmit data, or the physical structure of the network, is called the physical topology. Physical topology defines how the systems are physically connected. It represents the physical layout of the devices on the network. The logical topology defines how the systems communicate across the physical topologies.
Logical topologies are bound to network protocols and describe how data is moved across the network. ...
EXAMPLE : twisted pair Ethernet is a logical bus topology in a physical star topology layout. while IBM's token ring is a logical ring topology, it is physically set up in star topology." [Logical topology. Wikipedia]
This Cisco logical computer network diagram example was created using the ConceptDraw PRO diagramming and vector drawing software extended with the Cisco Network Diagrams solution from the Computer and Networks area of ConceptDraw Solution Park.
How to Draw a Good Diagram of a Business Workflow?
To draw a good diagram of a business workflow you should have a ready-to-use set of pre-designed objects you may drag-and-drop to your document focusing on the workflow structure and meaning, not drawing tools. ConceptDraw DIAGRAM with Workflow Diagrams solution provides complete set of design element you may use to draw a good diagram of a business workflow.SIPOC Diagram
SIPOC is a tool that summarizes the inputs and outputs of one or more processes in table form.You need to draw professional looking SIPOC Diagram quick and easy? Pay please your attention on ConceptDraw DIAGRAM diagramming and vector drawing software. Extended with Business Process Mapping Solution from the Business Processes Area of ConceptDraw Solution Park, it suits ideal for this.
Business Report Pie. Pie Chart Examples
This sample shows the Business Report Pie Chart. The Pie Chart visualizes the data as the proportional parts of a whole, illustrates the numerical proportion. Pie Charts are very useful in the business, statistics, analytics, mass media.Emergency Plan
Fire emergency plan need to be in every building on each floor. The evacuation plan preliminary designed in ConceptDraw DIAGRAM software will help employees or family members when natural disasters, fires, hazardous leaks and other disaster events happen. Start drawing emergency blueprint from floor bounds, then put the inner walls and doors, and finally use arrows to show evacuation directions to fire exits.How to Create Presentation of Your Project Gantt Chart
During the planning, discussing and execution of a project you may need to prepare a presentation using project views such as the Gantt Chart, Multiproject Dashboard or Resource Usage View. It’s easy do with ConceptDraw PROJECT!- Explain With The Aid Of Suitable Diagram
- With The Aid Of Suitable Diagram Explain What Is Meant By Glycolysis
- Office Layout Plans | Explain Mis With Suitable Diagram
- Local area network (LAN). Computer and Network Examples | Cloud ...
- With The Aid Of Diagram Explain Glycolysis Process
- Explain Lan With A Suitable Diagrams
- With The Diagram Describe Glycosis
- Network Diagram Examples | With The Aid Of Diagram Explain ...
- With Aid Of An Anotated Diagram
- Matrix Organization Structure | Organizational Structure Total Quality ...
- Network Diagrams for Bandwidth Management | Computer Network ...
- With The Help Of Diagram Describe The Process Of Glycolysis
- With The Aid Of Diagram Explain What Does It Mean
- Concept Of Purchasing Cycle With Aid Of Diagram
- Block diagram - Porter's five forces model
- Biology | How to a Draw Biology Diagram | Computer Network ...
- With Aid Of A Diagram Describe The Construction Of Bars Topology
- Explain Lan Architecture Using Diagram
- Design elements - TCA cycle | Biology | Citric acid cycle (TCA cycle ...
- Biology | Design elements - TCA cycle | Biology Drawing | With The ...
- ERD | Entity Relationship Diagrams, ERD Software for Mac and Win
- Flowchart | Basic Flowchart Symbols and Meaning
- Flowchart | Flowchart Design - Symbols, Shapes, Stencils and Icons
- Flowchart | Flow Chart Symbols
- Electrical | Electrical Drawing - Wiring and Circuits Schematics
- Flowchart | Common Flowchart Symbols