HelpDesk
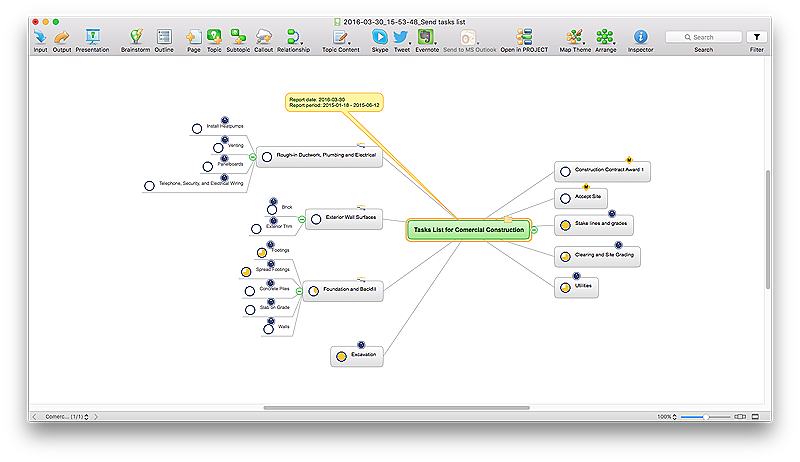
How to Generate ConceptDraw PROJECT Standard Reports on Mac
Project reporting is one of the key functions of effective project management. Using regular project reports, project manager can constantly track and analyze the project’s execution. This analytic process can help to ensure that the team reaches the best possible solutions. ConceptDraw PROJECT is a professional software tool for project management with the advanced mechanism of reporting. You can create the set of regular reports on project activities, task statuses, cash flow and assignments in MS Excel format. Mind map reports are also available.HelpDesk
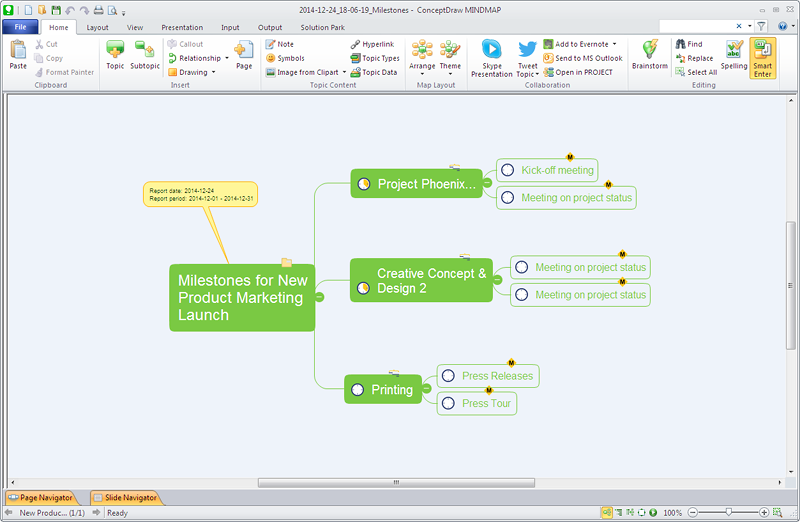
How to Generate ConceptDraw PROJECT Standard Reports on PC
The reporting capabilities of ConceptDraw PROJECT are really impressive. This section will help you find out what useful information can be obtained when using ConceptDraw PROJECT standard reports.Product Overview
ConceptDraw PROJECT is a vigorous tool for managing single or multiple projects. It lets you determine all essential elements involved into project, control schedules, resources and finances, and monitor projects' progress in most effective yet simple manner.Dashboard
ConceptDraw PRO extended with Sales Dashboard solution from the Marketing area of ConceptDraw Solution Park is a perfect software for creating the live dashboard for the business data and progress visualization.Performance Indicators
ConceptDraw PRO diagramming and vector drawing software offers the useful tools of the Sales Dashboard solution from the Marketing area for easy creating professional looking live dashboards which allow to track the business sales activity and progress thanks to representing the Key Performance Indicators (KPIs) on them.
 Sales Dashboard
Sales Dashboard solution extends ConceptDraw PRO software with templates, samples and library of vector stencils for drawing the visual dashboards of sale metrics and key performance indicators (KPI).
- Project Dashboard Excel
- Ms Project Dashboard Report
- PM Dashboards | Project management task status dashboard | How ...
- Sample Project Dashboard Excel
- How to Create Project Dashboard on Mac | How to Create Multiple ...
- Excel Dashboard Multiple Projects Tracking
- Project Reporting Dashboard
- PM Dashboards | KPI Dashboard | How to Create Project ...
- How to Export Project Data to MS Excel Worksheet | How to ...
- How To Create Project Report
- Status Dashboard | PM Dashboards | How to Create Project ...
- Status Dashboard | PM Dashboards | How to Create Project ...
- How To Create Project Report | | Business Intelligence Dashboard ...
- Key Performance Dashboard Excel
- Project Dashboard For Multiple Projects
- Project Management Software | ConceptDraw
- Excel Kpi Dashboard Templates
- PM Dashboards | How to Track Your Project Plan vs. the Actual ...
- PM Dashboards | How to Create Project Dashboard on Mac | Status ...
- Project Update Dashboard


