HelpDesk
How to Manage Multiple Projects on Windows
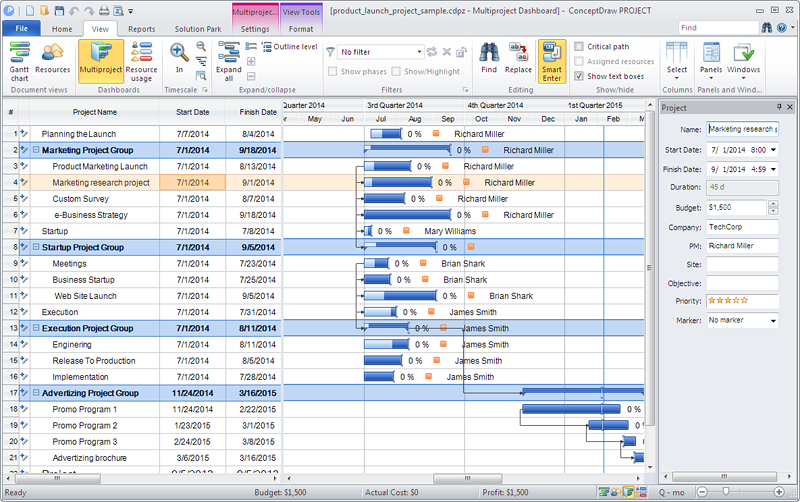
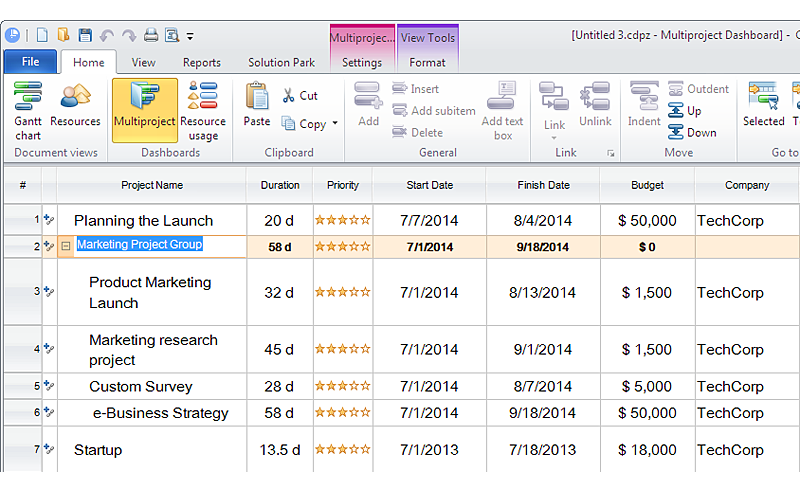
ConceptDraw PROJECT lets you to track multiple projects at the same time.
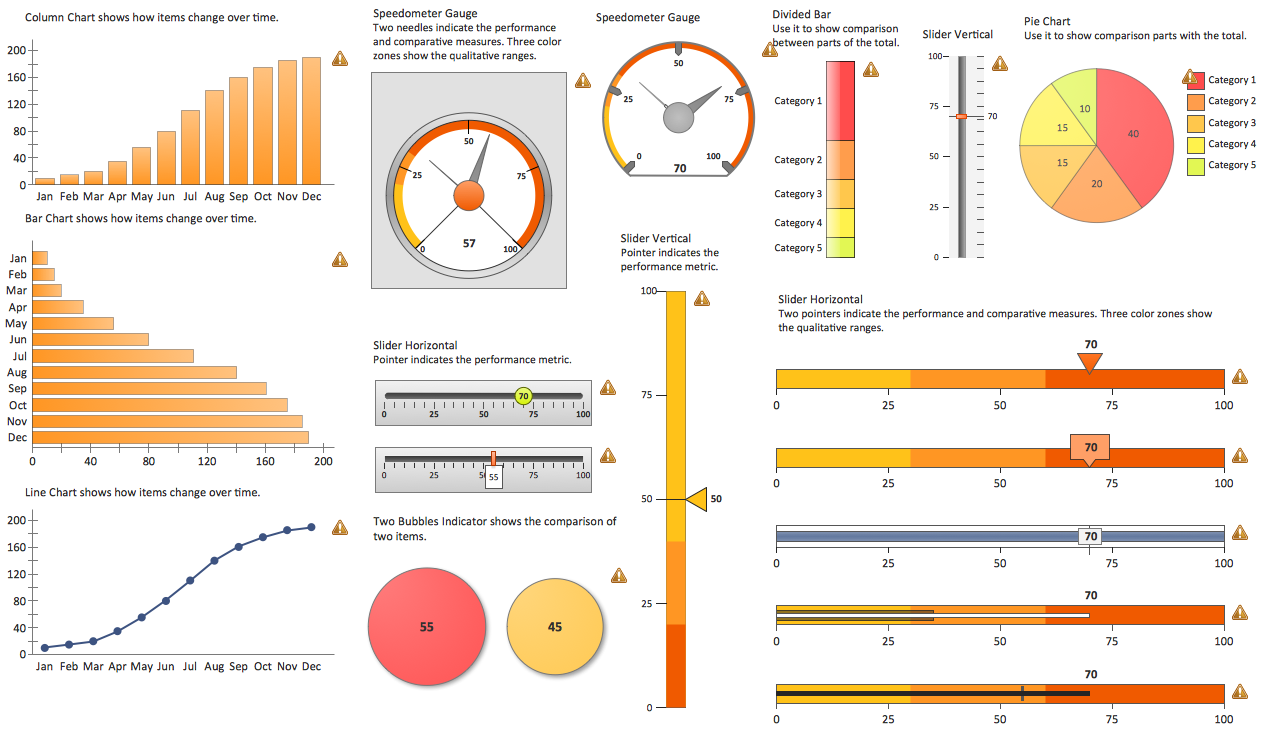
 PM Dashboards
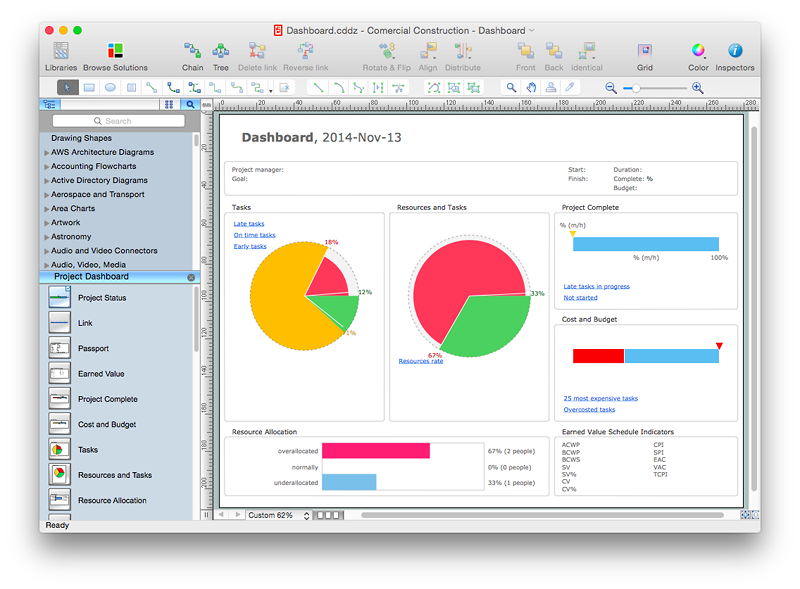
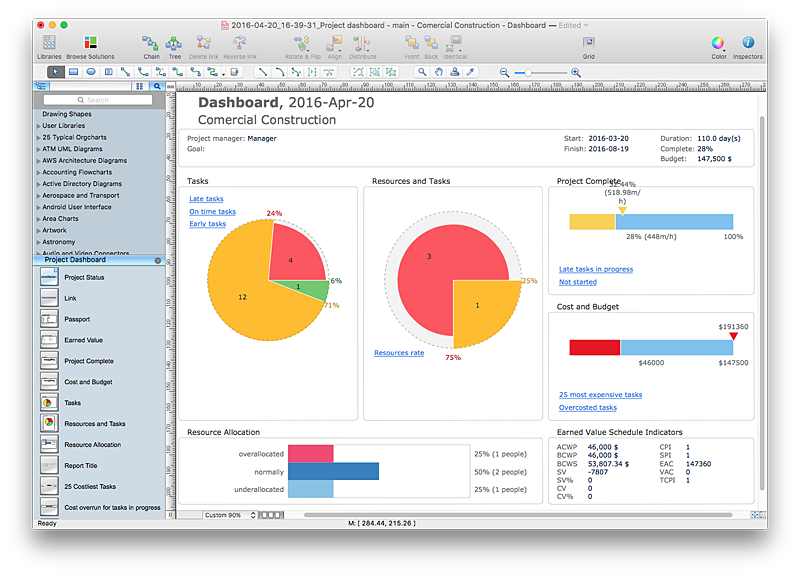
This solution extends ConceptDraw PRO and ConceptDraw PROJECT software with the ability to clearly display the identified key performance indicators for any project.
HelpDesk
How to Create Project Dashboard on Mac
The visual Project Dashboard within ConceptDraw Office is the best way to deliver a clear view of project performance to all project participants.
 Status Dashboard
Status dashboard solution extends ConceptDraw PRO software with templates, samples and vector stencils libraries with graphic indicators for drawing the visual dashboards showing status data.
HelpDesk
How to Track Your Project Plan vs. the Actual Project Condition
Conceptdraw PROJECT provides user with the possibility to track how the project is going. Project Manager can compare the actual data with the planned and assess possible measures to resolve issues. Conceptdraw PROJECT has several types of visual reports that can help to assess visually the difference between planned and actual project data.How To Create Project Report
ConceptDraw PROJECT contains an extensive tool set to help project managers. The rich data visualization capability that is provided by ConceptDraw products helps you create project dashboards, one-click reports, multi-project views, Gantt charts, and resource views. Let′s learn how to get maximum value using ConceptDraw PROJECT!Gantt chart examples
All Gantt charts were made using ConceptDraw PROJECT. ConceptDraw PROJECT works both on Windows and Mac OS X. It allows to schedule a voluntary number of projects in a single Workspace document and lets easily share tasks and resources among them. ConceptDraw PROJECT shares files among Windows and Mac OS X.A KPI Dashboard Provides the Answers Your Sales Team
Sales dashboard is a tool that provides the answers to all questions your sales team may have. A mature sales dashboard provides complete set of KPI to shows corporate, team or personal performance to keep sales process clear.Construction Project Chart Examples
ConceptDraw PROJECT provides a set of construction Gantt chart examples. Project manager requires task tracking, and project examples best approach to start. Make your project applying one of our ready-made examples.HelpDesk
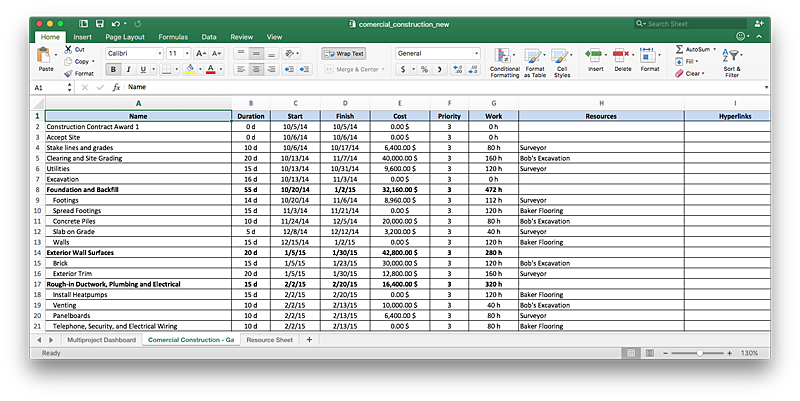
How to Export Project Data to MS Excel Worksheet
You can share your ConceptDraw PROJECT files with colleagues who use MS Excel®using the export capabilities of ConceptDraw PROJECT.HelpDesk
How to Create Multple Projects Schedule on Windows
When considering project change requests, project manager can model their interaction by grouping or dividing into sub-projects. ConceptDraw PROJECT is simple project scheduling software, it allows grouping individual projects into a multiple project that can use a common resource pool and a synchronized task schedule. You can create a detailed schedule of your multiple project quickly and easy. ConceptDraw PROJECT also provide critical path scheduling software tools, the Multiproject Dashboard helps you plan multiple projects while providing you with overall view. Grouping Projects considers each project similarly to a phase, so it does not have its own independent tasks. Multiproject Dashboard enables planning and managing several projects simultaneously using the single resource pool for all projects.Business Intelligence Dashboard Software
ConceptDraw PRO is a business intelligence dashboard software that allows you produce sales dashboard that suites your specific needs. To see how your business can improve with sales dashboards select KPI and start tracking it.HelpDesk
How to Generate ConceptDraw PROJECT Standard Reports on Mac
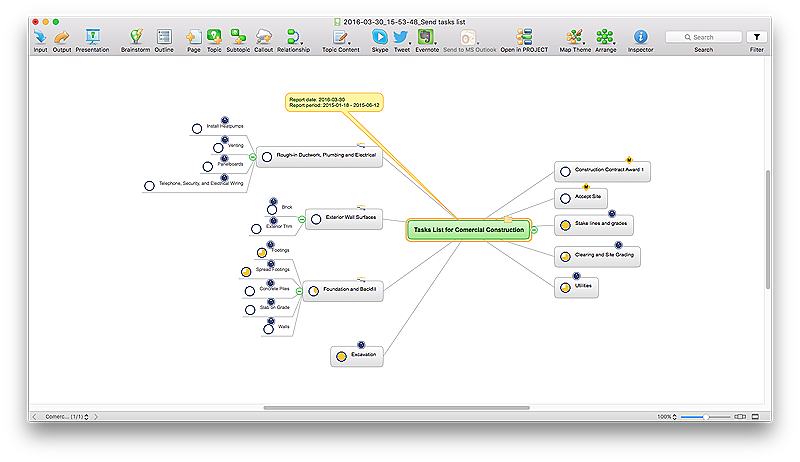
Project reporting is one of the key functions of effective project management. Using regular project reports, project manager can constantly track and analyze the project’s execution. This analytic process can help to ensure that the team reaches the best possible solutions. ConceptDraw PROJECT is a professional software tool for project management with the advanced mechanism of reporting. You can create the set of regular reports on project activities, task statuses, cash flow and assignments in MS Excel format. Mind map reports are also available.HelpDesk
How to Use ConceptDraw Sales Dashboard Solution
The interactive visual dashboard is a valuable tool for any sales team. Sales dashboard allows you to view and monitor sales indicators that are important for manager and sales staff . It helps to use the timely and reliable information to improve the quality of sales performance and increase sales revenues. ConceptDraw Sales Dashboard solution is a tool for both: sales manager and sales team. It provides the visualization of key performance indicators that are critical to the entire sales organization. The custom sales dashboard displays the real-time information on sales performance KPIs with the help of intuitive and easy-to-understand diagrams and charts. Sales Dashboard helps the entire team see where they are, and what needs to be done. With ConceptDraw PRO you can easily create a visual Sales Dashboard using Live Objects Technology.
HelpDesk
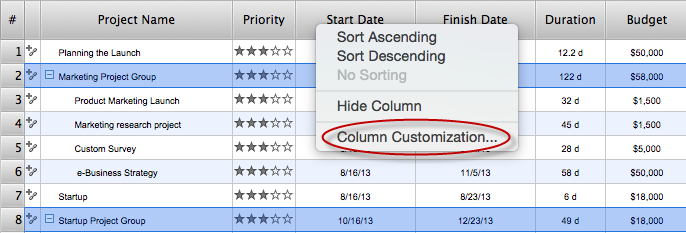
What Information can be Displayed in the Multiproject Dashboard View
What information can can contain the projects list
- Project Management Dashboards Examples
- Project Dashboard Example
- PM Dashboards | How To Create Project Report | A KPI Dashboard ...
- Construction Project Chart Examples | PM Dashboards | Best Tool ...
- Project task status dashboard - Template | Status Dashboard | How ...
- Project Business Dashboard Examples
- Software Project Dashboard Template
- Project Dashboard Examples Free
- Project Status Dashboard Template
- Status Dashboard | Project task status dashboard - Template | PM ...
- Project Dashboard Excel
- Sample Project Dashboard Excel
- Free Project Dashboard Indicators
- Project Dashboard Examples
- Status Dashboard | Dashboard | Project task status dashboard ...
- Project task status dashboard - Template
- Project Management Dashboard Sample
- PM Dashboards | Project management task status dashboard | How ...
- Construction Project Chart Examples | PM Dashboards | How To ...
