This site uses cookies. By continuing to browse the ConceptDraw site you are agreeing to our Use of Site Cookies.

healthcare workflow diagram, healthcare workflow, healthcare workflow management, workflow analysis healthcare, clinical workflows in healthcare Healthcare Management Workflow Diagrams

healthcare workflow diagram, healthcare workflow, healthcare workflow management, workflow analysis healthcare, clinical workflows in healthcare
Healthcare Management Workflow Diagrams solution contains large set of colorful samples and libraries with predesigned vector pictograms and symbols of health, healthcare equipment, medical instruments, pharmaceutical tools, transport, medication, departments of healthcare organizations, the medical icons of people and human anatomy, as well as the predesigned flowchart objects, connectors and arrows, which make it the best for designing clear and comprehensive Medi?al Workflow Diagrams and Block Diagrams, Healthcare Management Flowcharts and Infographics, Healthcare Workflow Diagram, for depicting the healthcare workflow and clinical workflows in healthcare, for making the workflow analysis healthcare and healthcare workflow management.
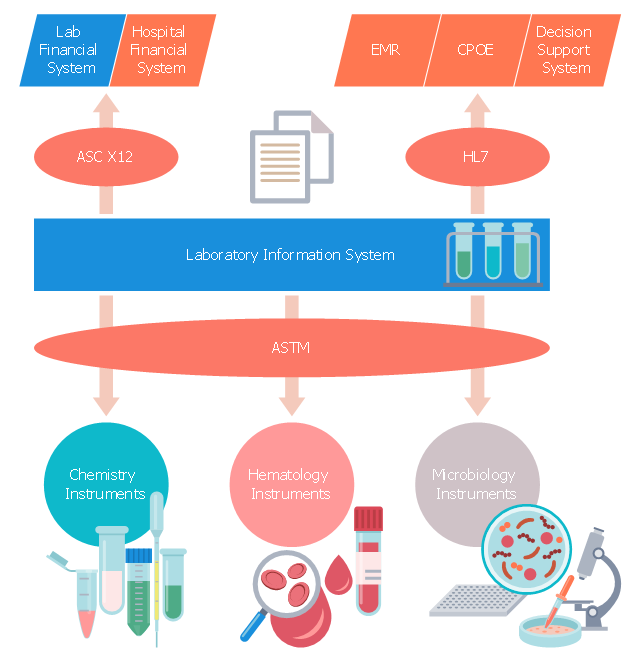
This medical flow chart sample shows logical connections to/ from laboratory information system (LIS) within the hospital.
It was drawn on the base of Wikimedia Commons file: WithinHospital.jpg. [commons.wikimedia.org/ wiki/ File:WithinHospital.jpg]
This file is licensed under the Creative Commons Attribution-Share Alike 3.0 Unported license. [creativecommons.org/ licenses/ by-sa/ 3.0/ deed.en]
"A laboratory information management system (LIMS), sometimes referred to as a laboratory information system (LIS) or laboratory management system (LMS), is a software-based laboratory and information management system with features that support a modern laboratory's operations. Key features include — but are not limited to — workflow and data tracking support, flexible architecture, and data exchange interfaces, which fully "support its use in regulated environments". The features and uses of a LIMS have evolved over the years from simple sample tracking to an enterprise resource planning tool that manages multiple aspects of laboratory informatics." [Laboratory information management system. Wikipedia]
The medical flowchart example "Laboratory Information System within the hospital" was designed using ConceptDraw PRO software extended with Healthcare Workflow Diagrams solution from Business Processes area of ConceptDraw Solution Park.
Medical flowchart
Medical flowchart, vacutainer, blood tube, test tube, rectangle, pasteur pipette, parallelogram, microtiter plate, microcentrifuge tube, microbiological laboratory, hematology, file, eyedropper, ellipse, drawing shapes, document, circle, centrifuge tube, biochemical laboratory, arrow up, arrow down, Petri dish,

How to Create Flowcharts for an Accounting Information System

Accounting information is a system of processes to represent financial and accounting data that is used by decision makers. To represent accounting processes there are special symbols which are used to create accounting flowcharts.
Flowcharts help users of Accounting Information System to understand the step sequences of accounting processes. Use ConceptDraw DIAGRAM with Accounting Flowcharts solution to document and communicate visually how accounting processes work, and how each operation is done.

Flowchart on Bank. Flowchart Examples

This sample was created in ConceptDraw DIAGRAM diagramming and vector drawing software using the Flowcharts solution from the Diagrams area of ConceptDraw Solution Park.
This sample shows the Flowchart of the Subprime Mortgage Crisis. This Flowchart describes the decline in housing prices when the housing bubble burst and what it caused on the housing and financial markets. You can also see the Government and Industry responses in this crisis situation.
Create Flowchart on Bank

Data Flow Diagram

Data flow diagram (DFD) is the part of the SSADM method (Structured Systems Analysis and Design Methodology), intended for analysis and information systems projection. Data flow diagrams are intended for graphical representation of data flows in the information system and for analysis of data processing during the structural projection. Data flow diagram often used in connection with human process and can be displayed as workflow diagram. The critical Process Flow Diagram is another flowchart technique for designing data flow in connection with organizational processes. The critical Process flow diagram may use different range of symbols than a classic workflow diagram.

ConceptDraw DIAGRAM - Organizational chart software

ConceptDraw - organizational chart software allows quickly create organizational charts, flow charts, time lines, and much more. Use it for drawing organizational chart for any size company and analyzing organizational structure.

Create Organizational Chart

CSOdessa team is happy to provide cost effective Organizational Chart Software for companies of any size. It is a ConceptDraw DIAGRAM extended with Organizational Charts Solution from the Management Area.
ConceptDraw DIAGRAM organizational chart professional software allows quickly create organizational charts, flow charts, time lines, and much more. Use it for drawing organizational chart for any size company and analyzing organizational structure. Use ConceptDraw to create organizational chart, visualize company Organizational chart, hospital Organizational chart, hotel Organizational chart, corporate organizational chart, etc.

How to Draw an Organization Chart

How to Draw an Organization Chart - The innovative ConceptDraw Arrows10 Technology included in ConceptDraw DIAGRAM is a powerful drawing tool that changes the way diagrams are produced.
While making the drawing process easier and faster.
Video tutorial on creating orgchart with ConceptDraw products. Try ConceptDraw for creating orgchart professional presentations!

Taxi Service Data Flow Diagram DFD Example

This sample shows the Data Flow Diagram of the Taxi Service and interactions between the Clients, Operators and Divers, as well as Orders and Reports databases.

EIGRP. Computer and Network Examples

The Enhanced Interior Gateway Routing Protocol (EIGRP) is a progressive distance-vector dynamic routing protocol. It was developed by the Cisco Systems and is available as an open standard from 2013.
EIGRP is used to help automate routing decisions and configuration of the computer network. It allows the routers of the same logical area automatically share route information.

Work Order Process Flowchart. Business Process Mapping Examples

Create your own cross-functional flow charts of order processing steps using variety of vector objects from the libraries of Business Process Mapping Solution for ConceptDraw DIAGRAM Business Mapping Software and also collection of Business Process Maps, Flowcharts, Swim Lanes Diagrams and SIPOC Diagrams, and template from ConceptDraw STORE to create your own professional looking diagrams
The cross-functional flow chart example shows business process mapping of the real property work order.

Data Flow Diagram (DFD)

This example is created using ConceptDraw DIAGRAM enhanced with solution Data Flow Diagrams. This diagram shows one of the business processes to simplify and accelerate understanding, analysis, and representation.

Organizational Chart

An organizational chart is a diagram that shows the structure of an organization and the relationships of its parts. ConceptDraw DIAGRAM extended with Organizational Charts Solution from the Management Area is powerful Organizational Chart Software.

Examples of Flowcharts, Org Charts and More

ConceptDraw examples covers a broad spectrum of business graphics categories. We separated all the graphic documents on application areas and had produced multiple solutions for each of them. ConceptDraw provides a wide variety of examples such as flowcharts, organizational charts, business charts, UML diagrams, database and ERD, directional map, network diagrams and lots more. Each solution accommodates 10+ examples that shows specific application cases of a diagram. ConceptDraw STORE is an application for downloading solutions with examples, templates and stencil libraries. Please choose any examples you are interested in, alternatively download them for free; you will need to install ConceptDraw to view them. As you will see, ConceptDraw is very powerful, you can use more than 10000 symbols, examples, and many pre-drawn templates, to create your own spectacular flowcharts, business diagrams, network diagrams and lots more, effortlessly, and in no time at all.
What is ConceptDraw OFFICE

business process flow diagrams, business process diagram example, business process diagram, process diagrams Business Process Diagrams

business process flow diagrams, business process diagram example, business process diagram, process diagrams
Business Process Flow Diagrams solution extends the ConceptDraw DIAGRAM BPM software with RapidDraw interface, templates, business process diagrams examples and numerous libraries based on the BPMN 1.2 and BPMN 2.0 standards, which give you the possibility to visualize equally easy simple and complex processes, to design business models, to quickly develop and document in details any business processes on the stages of project’s planning and implementation.

Fire Exit Plan. Building Plan Examples

In order to make it safe both for you and for your employees as well as your clients who come to pay you a visit time to time and who can get trapped in a building, especially if your office is in a high building on one of the top floors of it, then you must make the fire exit plan in case of fire enabling people to live the building on time avoiding being hurt, injured or even dead. For making such plan you can always use ConceptDraw DIAGRAM software which is one of the best drawing applications providing all of the necessary tools for making your own plans, including the fire exit ones.

Local area network (LAN). Computer and Network Examples

A local area network (LAN) is a devices network that connect with each other in the scope of a home, school, laboratory, or office. Usually, a LAN comprise computers and peripheral devices linked to a local domain server. All network appliances can use a shared printers or disk storage. A local area network serve for many hundreds of users. Typically, LAN includes many wires and cables that demand a previously designed network diagram. They are used by IT professionals to visually document the LANs physical structure and arrangement.
ConceptDraw - Perfect Network Diagramming Software with examples of LAN Diagrams. ConceptDraw Network Diagram is ideal for network engineers and network designers who need to draw Local Area Network diagrams.
How to Draw a Computer Network

Social Media Response DFD Flowcharts - diagramming software ( Mac PC )

Diagramming software for Mac and PC - create flowcharts and presentations for Social Media Organizing.

Timeline Examples

ConceptDraw DIAGRAM diagramming and vector drawing software offers the Timeline Diagrams solution from the Management area which is rich for the timeline examples, samples, templates and ready-to-use vector shapes.

How To Create Emergency Plans and Fire Evacuation

Once you start using ConceptDraw DIAGRAM all together with numerous libraries and templates of already existing, pre-designed plans, schemes, charts, flowcharts as well as diagrams, you will realize how simple and genius this application is.