This site uses cookies. By continuing to browse the ConceptDraw site you are agreeing to our Use of Site Cookies.

Local area network (LAN). Computer and Network Examples

A local area network (LAN) is a devices network that connect with each other in the scope of a home, school, laboratory, or office. Usually, a LAN comprise computers and peripheral devices linked to a local domain server. All network appliances can use a shared printers or disk storage. A local area network serve for many hundreds of users. Typically, LAN includes many wires and cables that demand a previously designed network diagram. They are used by IT professionals to visually document the LANs physical structure and arrangement.
ConceptDraw - Perfect Network Diagramming Software with examples of LAN Diagrams. ConceptDraw Network Diagram is ideal for network engineers and network designers who need to draw Local Area Network diagrams.
How to Draw a Computer Network

Interior Design. School Layout — Design Elements

To be able to draw the interior design school layout you need design elements for creating one in the right and smart software ConceptDraw DIAGRAM.

Example of Organizational Chart

Example of Organizational Chart - Lots of organization chart examples created by ConceptDraw Organizational Chart Software. Include company organizational chart, hospital organizational chart, hotel Organizational chart, corporate organizational chart samples etc
How to draw an Organizational Chart
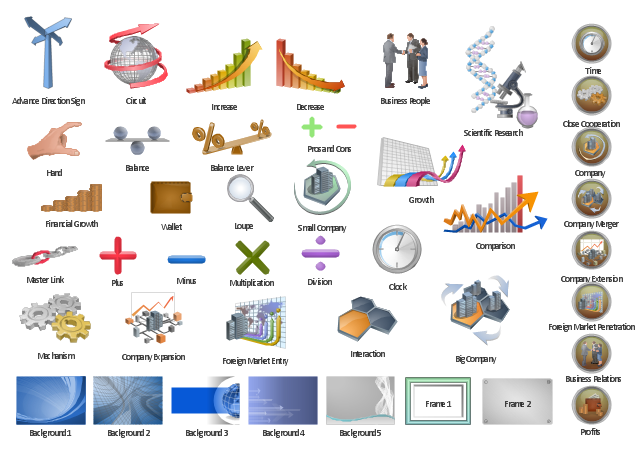
The vector clipart library "Presentation" design elements contains 45 symbols you can use to design your presentation slides and illustrations using the ConceptDraw PRO diagramming and vector drawing software.
"Although some think of presentations in a business meeting context, there are often occasions when that is not the case. For example, a non-profit organization presents the need for a capital fund-raising campaign to benefit the victims of a recent tragedy; a school district superintendent presents a program to parents about the introduction of foreign-language instruction in the elementary schools;an artist demonstrates decorative painting techniques to a group of interior designers; a horticulturist shows garden club members or homeowners how they might use native plants in the suburban landscape; a police officer addresses a neighborhood association about initiating a safety program. ...
A study done by Wharton School Of Business showed that the use of visuals reduced meeting times by 28 percent. Another study found that audiences believe presenters who use visuals are more professional and credible than presenters who merely speak. Other research indicates that meetings and presentations reinforced with visuals help participants reach decisions and consensus more quickly." [Presentation. Wikipedia]
The clip art example "Design elements - Presentation symbols" is included in the Presentation Clipart solution from the Illustration area of ConceptDraw Solution Park.
Presentation clip art and pictograms
Presentation clip art and pictograms, presentation,

Classroom Seating Chart

When developing the Classroom Seating Chart it is necessary to take into account the characteristics of the taken premises. Each seating place must to be comfortable and each pupil must to see good the teacher and the chalkboard. Let's design the Classroom Seating Chart in ConceptDraw DIAGRAM software extended with School and Training Plans Solution from the Building Plans Area.

Basic Flowchart Symbols and Meaning

Flowchart Symbols and Meaning - Provides a visual representation of basic flowchart symbols and their proposed use in professional workflow diagram, standard process flow diagram and communicating the structure of a well-developed web site, as well as their correlation in developing on-line instructional projects. See flowchart's symbols by specifics of process flow diagram symbols and workflow diagram symbols.
How to Build a Flowchart

School Floor Plans

ConceptDraw DIAGRAM is a powerful diagramming and vector drawing software. Extended with School and Training Plans Solution from the Building Plans Area it became the best software for quick and easy designing various School Floor Plans.

Campus Area Networks (CAN). Computer and Network Examples

A campus network provides wireless access to the Internet or LAN to users located in two or more buildings or in the open space surrounding those buildings. A campus network is usually set in the campus of a university, but the same kind of planning and design can be applied for other purposes. For example, the campus network can used for an office or industrial park, in a public place like a supermarket with an entertainment center, even on a farm. Another form of temporary campus network can exist during special events such as music festivals or rallies.
The elementary campus networks arise spontaneously: the radio signals from the access points, which provide network inside the building are not limited to its walls, so any user in the backyard can also get wireless network access. The larger and more complex campus network may have additional access points in places specially chosen for serving clients, i.e., on the lawn in front of the college or in a coffee shop around the corner.

ERD Symbols and Meanings

Crow's foot notation is used in Barker's Notation, Structured Systems Analysis and Design Method (SSADM) and information engineering. Crow's foot diagrams represent entities as boxes, and relationships as lines between the boxes. Different shapes at the ends of these lines represent the cardinality of the relationship.
The Chen's ERD notation is still used and is considered to present a more detailed way of representing entities and relationships.
To create an ERD, software engineers mainly turn to dedicated drawing software, which contain the full notation resources for their specific database design - ERD symbols and meanings. CS Odessa has released an all-inclusive Entity-Relationship Diagram (ERD) solution for their powerful drawing program, ConceptDraw DIAGRAM.
How to Build an Entity Relationship Diagram (ERD)

UML Use Case Diagram Example. Registration System

The use case diagram (behavior scenarios, precedents) is the initial conceptual representation of the system during its design and development. This diagram consists of actors, use cases and relationships between them. When constructing a diagram, common notation elements can also be used: notes and extension mechanisms.

This sample was created in ConceptDraw DIAGRAM diagramming and vector drawing software using the UML Use Case Diagram library of the Rapid UML Solution from the Software Development area of ConceptDraw Solution Park.
This sample shows the types of user’s interactions with the system and is used at the registration and working with the database system.

How To use Electrical and Telecom Plan Software

When drawing Electrical and telecom plan, you need to display electrical circuit, schematics, electrical wiring, digital circuits and house electrical plans, etc. It shows the electrical devices location and the scheme of electric and telecom wiring clearly and concisely enough.

For easy start, use Electric and Telecom plan solution templates and samples which will be opened right with standard electrical symbols and icons library. Or create your own electrical and telecom diagrams. Try now to make sure how easy and neat drawing electrical and telecom plan could be with ConceptDraw DIAGRAM!

Use Electrical and Telecom Plan Software to develop the home electrical plan, residential electric plan, telecom wireless plan, and other electric visual and telecommunication floor plans for design and construction, including outlets, switches, and fixtures.

Value Stream Mapping Symbols

VSM symbols are the best for a production process designing. The entire Value Stream Mapping method uses a graphical representation of the manufacturing process, factors' pros and cons, that all stakeholders can easily understand. Value Stream Mapping is a graphical technique that provides possibilities to improve analysis of a manufacturing process, at the stage of the transferring information or materials that required to deliver a product or service to the customer.

DFD Flowchart Symbols

A Data Flow Diagram (DFD) is a graphical technique which allows effectively model and analyze the information processes and systems. The ability to fast and easy create the DFDs is made possible with Data Flow Diagrams solution from the Software Development area of ConceptDraw Solution Park. For designing the Data Flow Diagrams are used simple DFD flowchart symbols which are connected each other by arrows depicting the data flow from one step to another.

Database Flowchart Symbols

Data base diagrams describes inter-related data and tables. It describes roles and relationships, internal and external dependencies, data exchange conventions and structures of knowledge domain.
ConceptDraw Software provides number of data-base chart libraries including major 49 vector symbols. Use these DFD flowchart symbol libraries to design data-base structure and models, use it to design data base process-oriented models, or simple data-oriented models. The are special drawing tools for making data flowcharts, data process diagrams, structured analysis diagrams, and information flow diagrams.

Electrical Symbols, Electrical Schematic Symbols

ConceptDraw DIAGRAM diagramming and vector drawing software enhanced with Electrical Engineering Solution from the Industrial Engineering Area of ConceptDraw Solution Park offers you powerful tools and libraries with incredibly large quantity of predesigned electrical symbols as electrical schematic symbols for easy designing professional looking Electrical Schematics.

Network VOIP. Computer and Network Examples

Voice-over-Internet protocol (VoIP) is a protocol of the voice communications and multimedia sessions through the Internet or other packet-switched networks. VoIP systems use the data compression techniques, encapsulated in a data-packet stream over IP. They allows users to use regular telephone networks through any internet service provider and anywhere. VoIP is also called IP telephony, Internet telephony, Voice over broadband (VoBB).
This example was created in ConceptDraw DIAGRAM using the Computer and Networks Area of ConceptDraw Solution Park and shows the VoIP Network.

How To Create Presentation for Trainings and Learning process

Learning via presentations is used widely in education. This is a frequently used tool on trainings, especially for remote training via Skype.

Data Flow Diagram Symbols. DFD Library

Data Flow Diagrams show information transfers and process steps of a system. The general concept is an approach of a depicting how occurs input in a system, further processes and what runs out. The aim of DFD is in accomplishing of understanding between developers and users. Data flow diagrams are maintained with other methods of structured systems analysis.

Basic Circles Venn Diagram. Venn Diagram Example

Venn Diagrams visualize all possible logical relations between several sets and are widely used in mathematics, logic, statistics, marketing, sociology, etc.
This Venn Diagram shows the relative complement of the set A with respect to the set B. It is the set of the elements in B, but not in A. In other words it is the set-theoretic difference B-A.

How To Make a Floor Plan

How To Make a Floor Plan? Usually drawing of Floor Plans is quite complex and time-taking process. But now thanks to the ConceptDraw DIAGRAM diagramming and vector drawing software extended with Floor Plans Solution from the Building Plans area of ConceptDraw Solution Park this process became quick and simple.