 Entity-Relationship Diagram (ERD)
Entity-Relationship Diagram (ERD) solution extends ConceptDraw DIAGRAM software with templates, samples and libraries of vector stencils from drawing the ER-diagrams by Chen's and crow’s foot notations.
 Entity-Relationship Diagram (ERD)
An Entity-Relationship Diagram (ERD) is a visual presentation of entities and relationships. That type of diagrams is often used in the semi-structured or unstructured data in databases and information systems. At first glance ERD is similar to a flowch
ERD Symbols and Meanings


Block Diagram

Best Value Stream Mapping mac Software

 Venn Diagrams
Venn Diagrams are actively used to illustrate simple set relationships in set theory and probability theory, logic and statistics, mathematics and computer science, linguistics, sociology, and marketing. Venn Diagrams are also often used to visually summarize the status and future viability of a project.
 Accounting Flowcharts
Accounting Flowcharts solution extends ConceptDraw DIAGRAM software with templates, samples and library of vector stencils for drawing the accounting flow charts.
 Football
The Football Solution extends ConceptDraw DIAGRAM software with samples, templates, and libraries of vector objects for drawing football (American) diagrams, plays schemas, and illustrations. It can be used to make professional looking documen
 Soccer
The Soccer (Football) Solution extends ConceptDraw DIAGRAM.5 (or later) software with samples, templates, and libraries of vector objects for drawing soccer (football) diagrams, plays schemas, and illustrations. It can be used to make professional looking
 Fault Tree Analysis Diagrams
This solution extends ConceptDraw DIAGRAM.5 or later with templates, fault tree analysis example, samples and a library of vector design elements for drawing FTA diagrams (or negative analytical trees), cause and effect diagrams and fault tree diagrams.
 School and Training Plans
School and Training Plans solution enhances ConceptDraw DIAGRAM functionality with extensive drawing tools, numerous samples and examples, templates and libraries of classroom design elements for quick and professional drawing the School and Training plans, School Floor plans, Classroom Layout, Classroom Seating chart, Lecture Room plans of any complexity. Each offered classroom seating chart template is a real help for builders, designers, engineers, constructors, as well as teaching personnel and other teaching-related people in drawing Classroom Seating charts and Training Room layouts with ConceptDraw DIAGRAM classroom seating chart maker.
 Workflow Diagrams
Workflow Diagrams solution extends ConceptDraw DIAGRAM software with samples, templates and vector stencils library for drawing the work process flowcharts.
 Pyramid Diagrams
Pyramid Diagrams solution extends ConceptDraw DIAGRAM software with templates, samples and library of vector stencils for drawing the marketing pyramid diagrams.
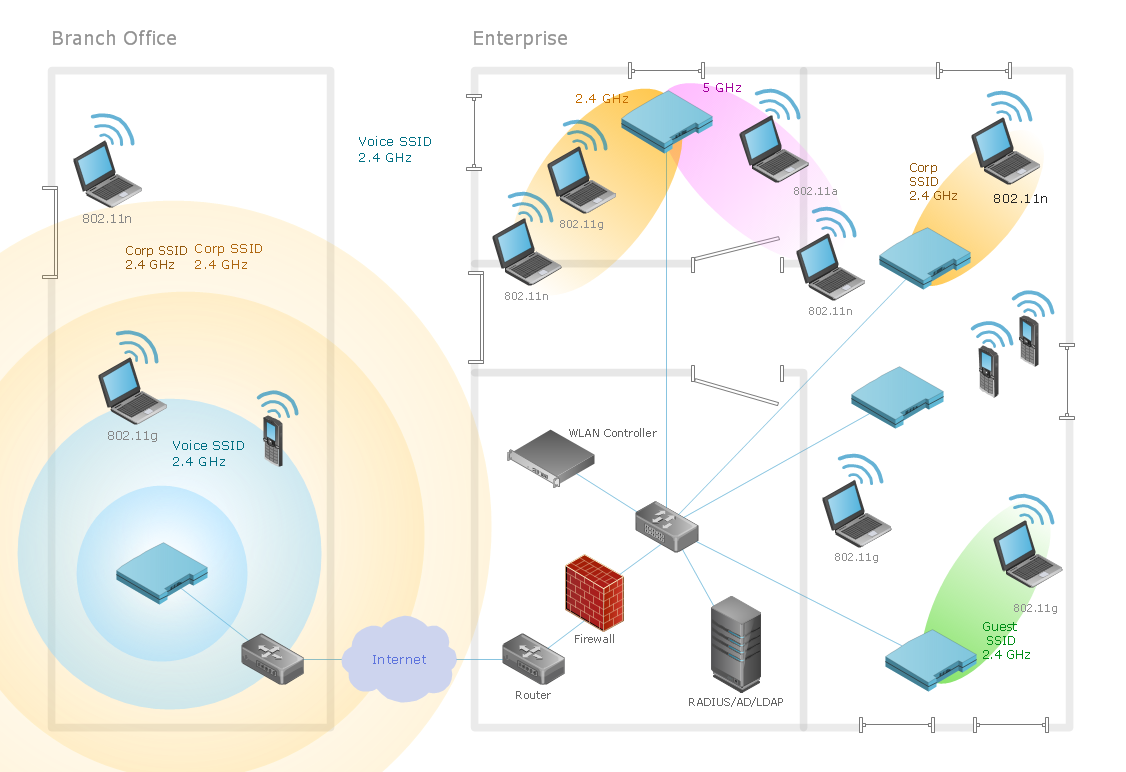
Find out what amount and type of equipment is needed for your office network

- School Management System Erd Diagram
- School Management System ER Diagram
- Er Model For School Management System
- Er Diagram Of School Management System
- Dfd For Library Management System Student And Librarian
- Er Diagram Examples For School Management
- ERD Symbols and Meanings | Entity-Relationship Diagram ( ERD ...
- Gant Chart in Project Management | Types of Flowcharts | ERD ...
- Flowchart School Management System
- Er Diagram For Bank Management System Pdf
- Entity-Relationship Diagram ( ERD ) | Football | School and Training ...
- Data Flow Diagram On School Management System On Yourdon ...
- News System Er Schema
- Entity-Relationship Diagram ( ERD ) | Windows Azure | Football ...
- School Management System Analysis
- Erd For Banking Management System
- Er Diagram For Disaster Management System
- Draw A Dfd Of Schools Libary
- Template For School Management System Class Diagram
- Rapid UML | Data Flow Diagrams ( DFD ) | Entity- Relationship ...