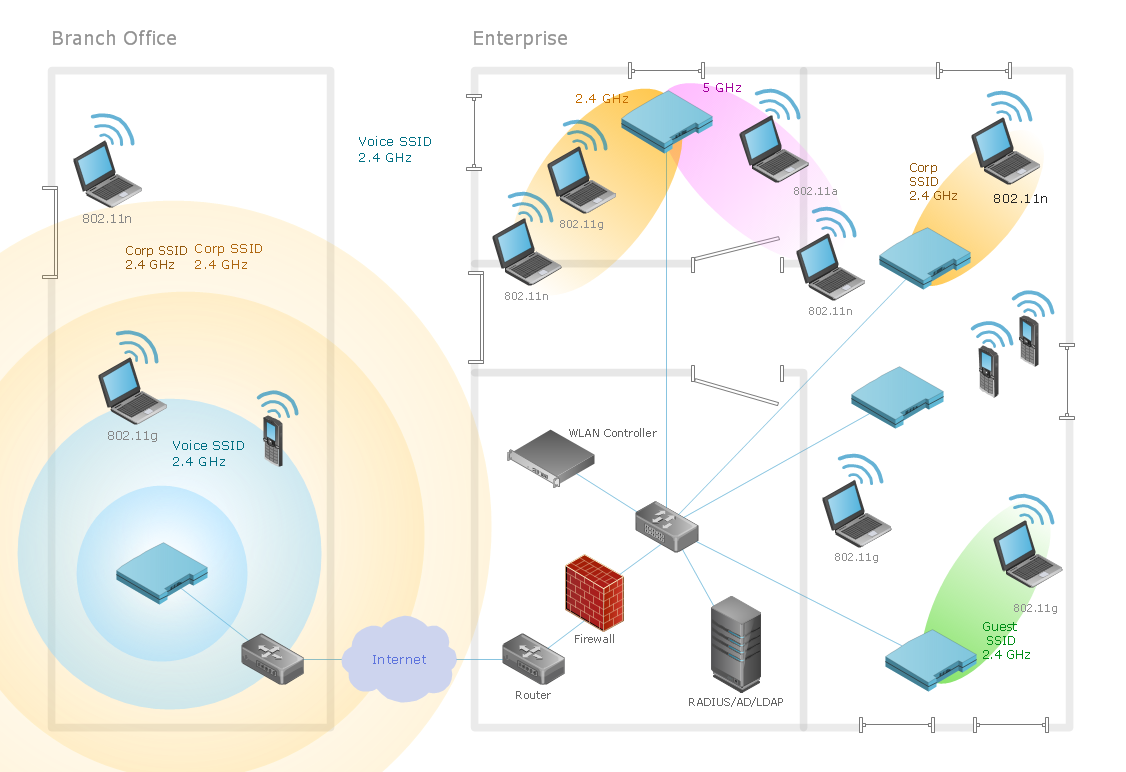
Sample 1. Wireless network diagram: Ultra high performance WLANs.
This diagram was created in ConceptDraw DIAGRAM using the Wireless Network library from the Wireless Networks solution.
When planning a WLAN for a complex office environment, it is important to be able to clearly display the interactions between all devices. This template shows the relationships between devices and their technical capabilities.
EIGHT RELATED HOW TO's:
The Internet Connectivity of the computers, mobile devices, computer networks to the Internet enables the users to access the various Internet services. There are many ways and technologies of the connection to the Internet with different data signaling rates: Wireless, Ethernet cable, Optical fiber, Dial-up, DSL, broadband Internet access, etc.
This example was created in ConceptDraw DIAGRAM using the Computer and Networks solution from the Computer and Networks area of ConceptDraw Solution Park and shows how the customers connect to ISPs and ISPs connect between the tiers (peering and transit).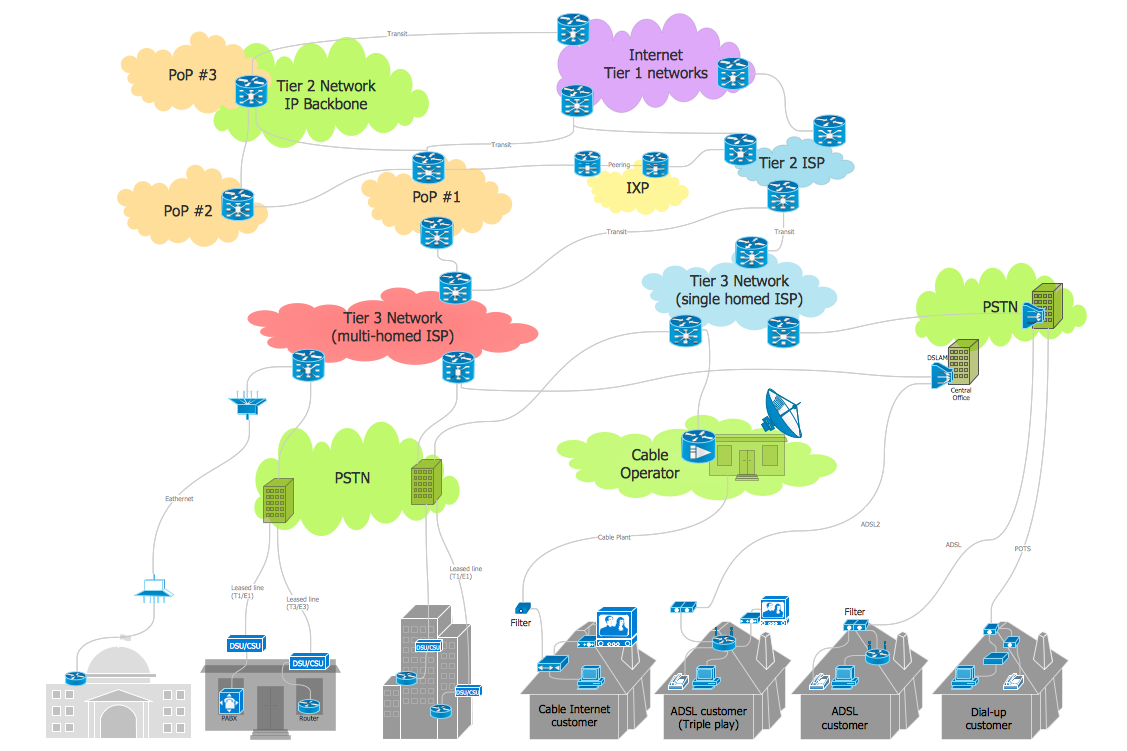
Picture: Internet Connectivity. Computer and Network Examples
Related Solution:
Designing a workspace or office involves careful consideration of form and function. Conceptdraw offers you all nessesary office design elements in one library. Combine, match, design and create!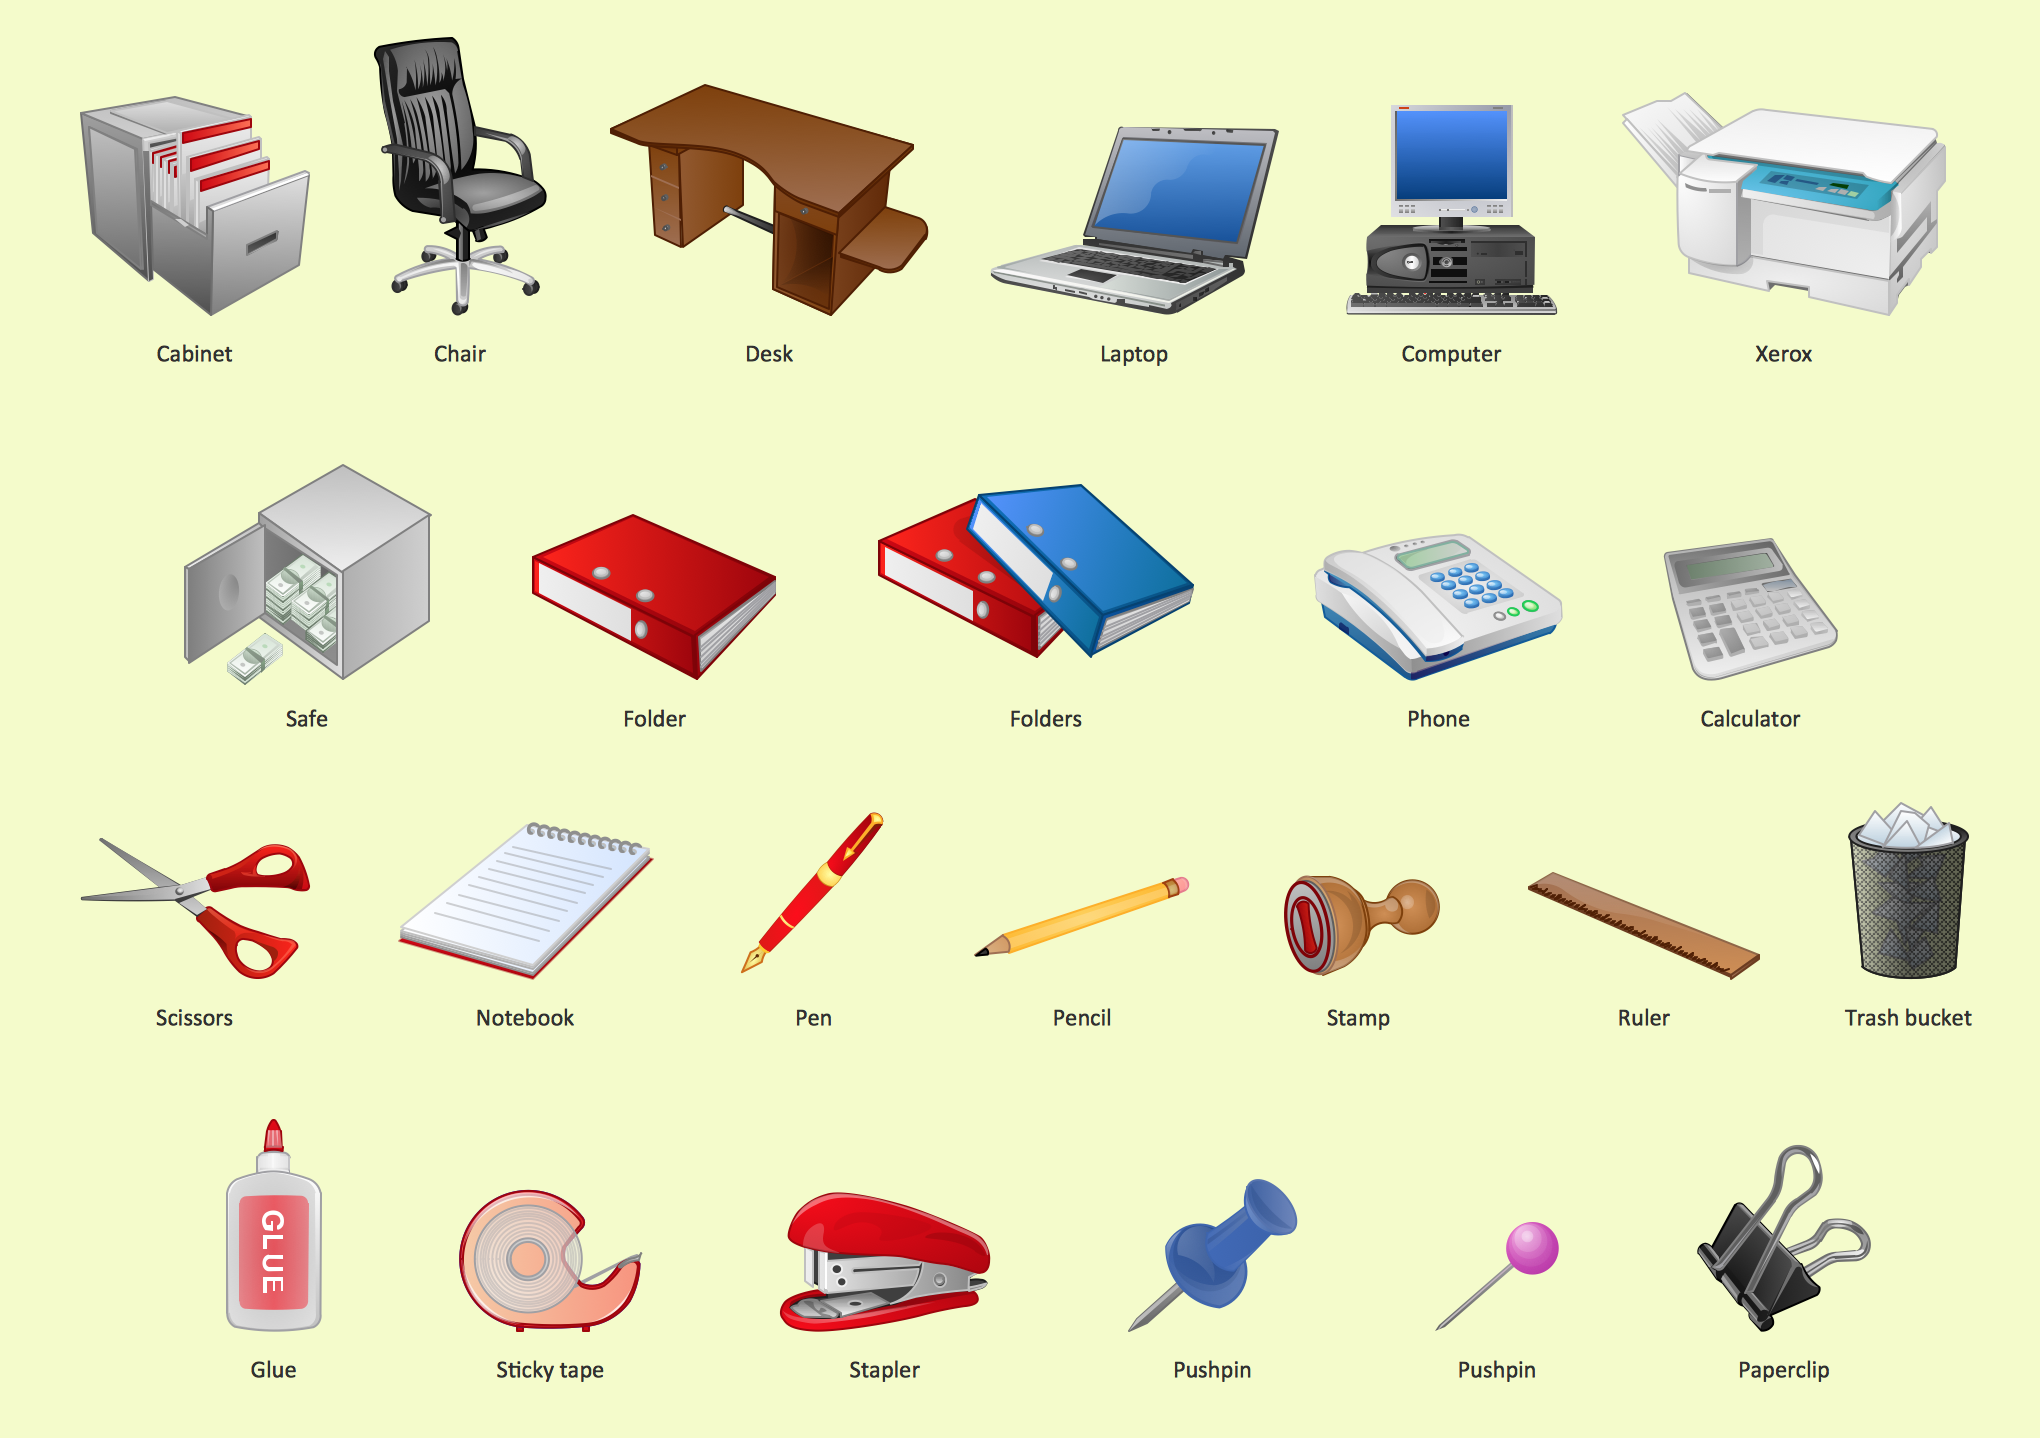
Picture: Office - Design Elements
Related Solution:
Home remodeling is something that many people face at one point or the other. The first part of any home remodeling is to create a new home plan. At first, it may seem a daunting and costly endeavor, but to take it on yourself, you just need to choose the right home remodeling software. Digital drawing software, such as ConceptDraw DIAGRAM , includes home plan examples to help you get started, as well as multiple advanced and powerful options, and an intuitive interface to go with them.
People who want to make changes in their houses planning have previously prepare a plan of rebuilding, of house, apartment or any other construction. If somebody desires to change anything in the interior design he also requires a plan, as it’s handy to see on the plan the coming result and then begin to implement it. All these tasks will be solved better with ConceptDraw DIAGRAM and its solution for Building Plans. You will design professional looking Home Plans quick and easy using the vector libraries, templates and samples, supplied with Solution.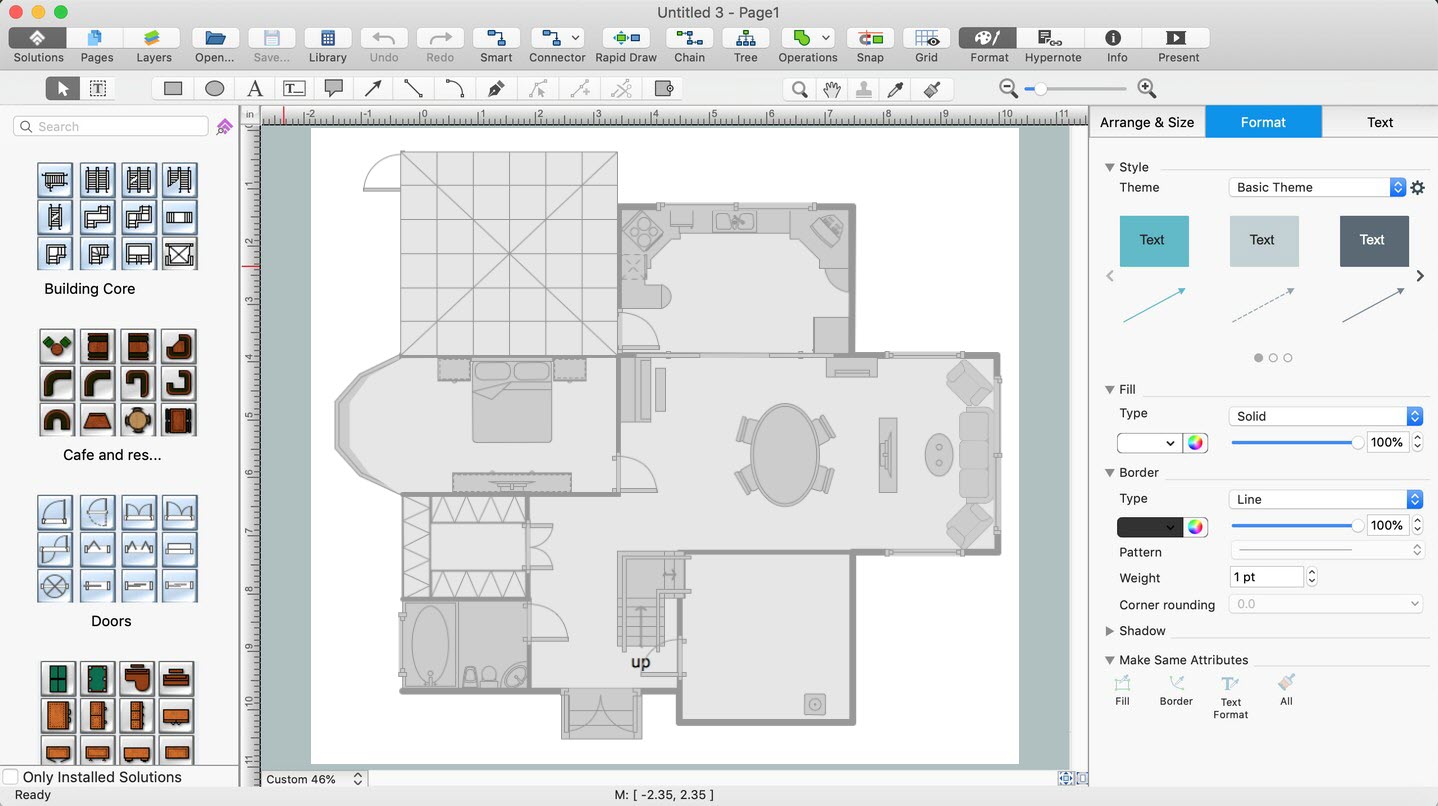
Picture: Home Remodeling Software. Home Plan Examples
Related Solution:
The Value stream is a totality of all actions on the projection, order composition and production: starting from creation a product project to launching this product, from order to delivery, from extraction of raw materials to ready product manufacturing. Value stream mapping is a process of visualization of these actions and creation of a detailed and graphical map.
Picture: Value stream with ConceptDraw DIAGRAM
Related Solution:
You need design the seating chart? The simple way is to use the specialized software. ConceptDraw DIAGRAM diagramming and vector drawing software extended with Seating Plans solution from the Building Plans area with powerful drawing tools, samples, seating chart template free will be ideal for you.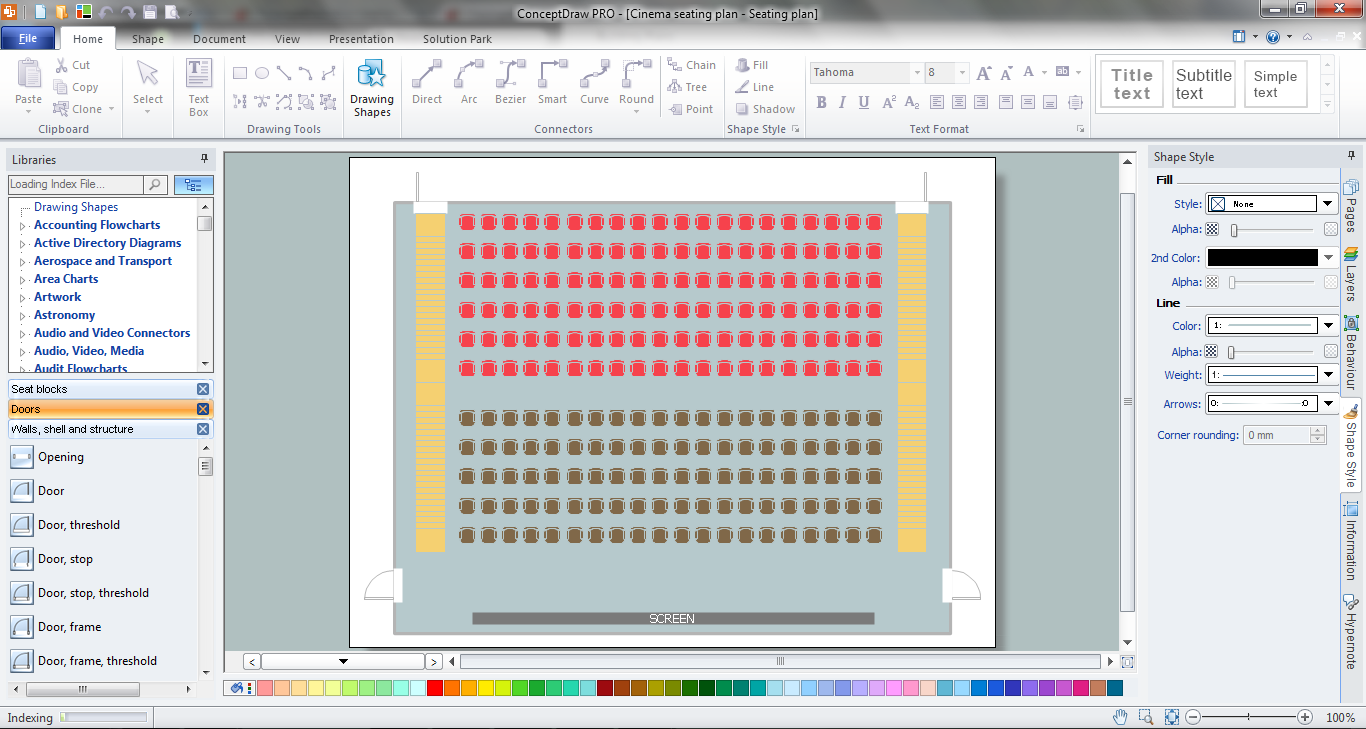
Picture: Seating Chart Template Free
Related Solution:
Architectural drawing allows to show the location of a building or ensemble of buildings on the ground, indicating the cardinal points. For centuries, people had been studying architecture in universities to learn how to draw building plans and now everyone can do it easily just using appropriate software. While developing the building plan, its graphic part, you can display the part of the floor or the entire floor of a building with an indication of the exact location of the drawn premise.
Small-sized apartments does not restrict the advanced interior design opportunities. Here is a detailed and precise floor plan of a pretty small apartment. A furniture objects are added to show possible interior of this home. This plan can be used to help somebody with a floor layout and furniture arrangement. Having this floor plan in a pocket while shopping would be useful to check if there is enough rooms for a new furniture.
Picture: How To Draw Building Plans
Related Solution:
The critical importance of house electrical plans. 🔸 Learn how to create efficient electrical layouts using the ConceptDraw DIAGRAM app. Enhance ✔️ safety, ✔️ functionality, and ✔️ compliance with electrical codes in your home projects with our comprehensive guide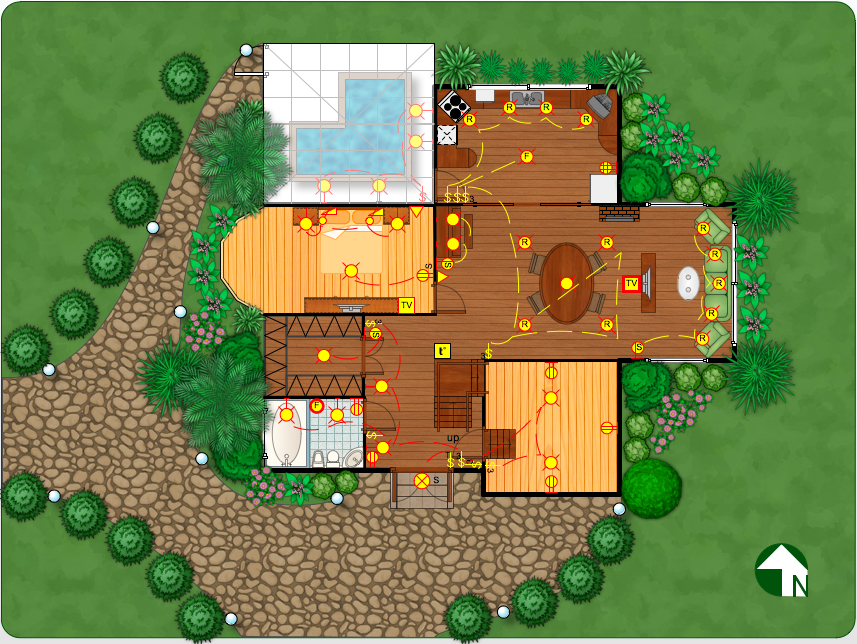
Picture:
Importance of House Electrical Plans
How to Create Electrical Layouts
with ConceptDraw DIAGRAM App
Related Solution:
ConceptDraw Office is the most effective tool for planning, tracking, and reporting all types of projects with strong management capabilities, user friendly functionality, and superior ease of use. In this tutorial video we will assist you in planning and managing a project using ConceptDraw Office.
Picture: How To Plan and Implement Projects Faster