Graphical User Interface Examples

User Interface Design Examples

Flow Diagram Software

Gantt chart examples

The vector stencils library "App icons" contains 24 icons of iOS 8 / iPhone 6 software applications.
Use it to design iOS 8 apps GUI prototypes and iPhone 6 software applications user interface sketches and mockups.
The icons example "App icons - Vector stencils library" was created using the ConceptDraw PRO diagramming and vector drawing software extended with the iPhone User Interface solution from the Software Development area of ConceptDraw Solution Park.
Messages
Calendar
Photos
Camera
Weather
Clock
Maps
Videos
Notes
Reminders
Stocks
Game Center
Newsstand
iTunes Store
App Store
iBooks
Health
Passbook
Passbook (iOS 7)
Settings
Phone
Mail
Music
Safari
Basic Diagramming


Mac OS User Interface Design Examples

Flowchart Programming Project. Flowchart Examples

The vector stencils library "Yosemite Apps" contains 20 OS X Yosemite user interface (UI) app icons.
Use these software application shortcuts to design graphic user interface (GUI) of your app for Mac OS X 10.10.
"Make a great first impression with a beautiful app icon. Your app icon is the first experience users have with your app, and it can have a marked effect on their expectations. Think of your app icon as your calling card, and spend the resources necessary to ensure that it makes the right impression on users. Decide whether your app is best represented by a realistic or graphic style icon." [developer.apple.com/ library/ mac/ documentation/ UserExperience/ Conceptual/ OSXHIGuidelines/ IconsGraphics.html#/ / apple_ ref/ doc/ uid/ 20000957-CH14-SW1]
The app icons example "Design elements - Yosemite Apps" was created using the ConceptDraw PRO diagramming and vector drawing software extended with the Mac OS User Interface solution from the Software Development area of ConceptDraw Solution Park.
App icons
Process Flow app for macOS

Excellent Examples of Infographic Maps

PERT Chart Software

Mac OS GUI Software

Entity-Relationship Diagram (ERD) with ConceptDraw DIAGRAM
 <br>with ConceptDraw DIAGRAM *")

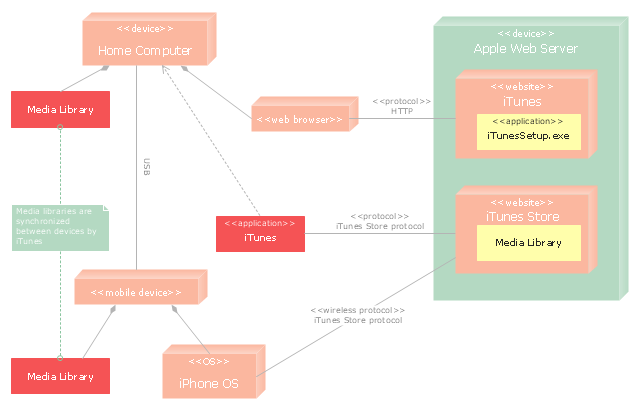
"iTunes is a media player, media library, and mobile device management application developed by Apple Inc. It is used to play, download, and organize digital audio and video on personal computers running the OS X and Microsoft Windows operating systems. The iTunes Store is also available on the iPod Touch, iPhone, and iPad.
Through the iTunes Store, users can purchase and download music, music videos, television shows, audiobooks, podcasts, movies, and movie rentals in some countries, and ringtones, available on the iPhone and iPod Touch (fourth generation onward). Application software for the iPhone, iPad and iPod Touch can be downloaded from the App Store." [iTunes. Wikipedia]
The UML deployment diagram example "Apple iTunes" was created using the ConceptDraw PRO diagramming and vector drawing software extended with the Rapid UML solution from the Software Development area of ConceptDraw Solution Park.
UML deployment diagram
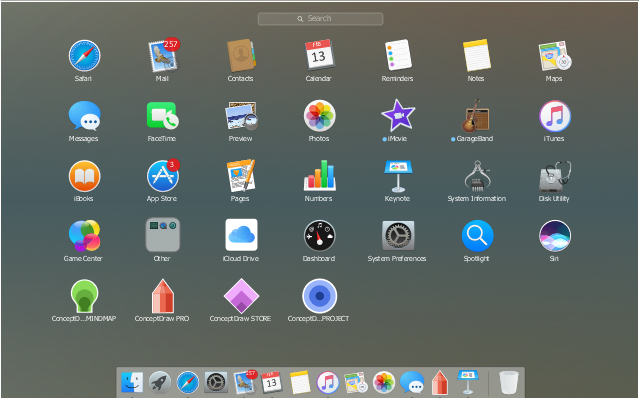
The example "macOS Sierra - Apps" shows usage of built-in app icons in Apple macOS operating system user interface (UI) design.
"The apps built into every Mac let you explore the world, connect with people, and work more efficiently. In OS X Yosemite, your apps have a simpler, more elegant look." [apple.com/ osx/ better-apps/ ]
The graphic user interface (GUI) example "macOS Sierra - Apps" was created using the ConceptDraw PRO software extended with the macOS User Interface solution from the Software Development area of ConceptDraw Solution Park.
UI example
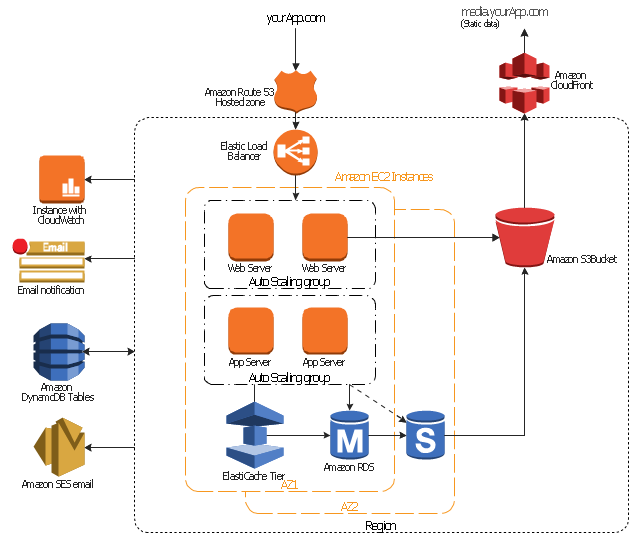
"A web application or web app is any application software that runs in a web browser or is created in a browser-supported programming language (such as the combination of JavaScript, HTML and CSS) and relies on a common web browser to render the application. ... Applications are usually broken into logical chunks called "tiers", where every tier is assigned a role. ...
For more complex applications, a 3-tier solution may fall short, and it may be beneficial to use an n-tiered approach, where the greatest benefit is breaking the business logic, which resides on the application tier, into a more fine-grained model. Another benefit may be adding an integration tier that separates the data tier from the rest of tiers by providing an easy-to-use interface to access the data. For example, the client data would be accessed by calling a "list_ clients()" function instead of making an SQL query directly against the client table on the database. This allows the underlying database to be replaced without making any change to the other tiers." [Web application. Wikipedia]
The AWS architecture diagram example "3-Tier Auto-scalable Web Application Architecture" was created using the ConceptDraw PRO diagramming and vector drawing software extended with the AWS Architecture Diagrams solution from the Computer and Networks area of ConceptDraw Solution Park.
AWS architecture diagram
UML Use Case Diagram Example. Registration System

Cross Functional Flowchart Examples

Workflow Diagram Software Mac

- Network Diagram Examples | 3-Tier Auto-scalable Web Application ...
- ConceptDraw STORE — ConceptDraw Applications | Store Layout ...
- Wireframe Examples | UML Use Case Diagram Example ...
- Wireframe Examples | Wireframing | UML Use Case Diagram ...
- Data Flow Diagram For Web Application
- Gantt chart examples | ConceptDraw PROJECT Project ...
- UML Block Diagram | UML Use Case Diagram Example ...
- Examples Of Apps Software On Pc
- | Android UI Design Tool | Android User Interface | Android ...
- Activity Diagram Example For Telecom Application
- UML deployment diagram example | Design elements - Bank UML ...
- Mac OS User Interface Design Examples | How to Design a Mockup ...
- Design elements - Windows 8 UI | Design elements - macOS ...
- Graphical User Interface Examples | GUI Software | Windows 8 UI ...
- UML deployment diagram
- Process Flowchart | | Flowchart Programming Project. Flowchart ...
- Web Application Component Diagram
- Line Chart Template for Word | Line Chart Examples | Line Graph ...
- Web App Diagram Example
- Pie Chart Software | Percentage Pie Chart. Pie Chart Examples | Pie ...