Sales Growth. Bar Graphs Example

Bar Chart Examples

 Bar Graphs
The Bar Graphs solution enhances ConceptDraw PRO v10 functionality with templates, numerous professional-looking samples, and a library of vector stencils for drawing different types of Bar Graphs, such as Simple Bar Graph, Double Bar Graph, Divided Bar Graph, Horizontal Bar Graph, Vertical Bar Graph, and Column Bar Chart.
Bar Graph

Financial Comparison Chart

Bar Diagrams for Problem Solving. Create space science bar charts with Bar Graphs Solution

Create bar graphs for visual solving your scientific problems and data comparison using the ConceptDraw PRO diagramming and vector drawing software extended with the Bar Graphs Solution from the Graphs and Charts area of ConceptDraw Solition Park.
Bar Chart Software

Bar Diagrams for Problem Solving. Create manufacturing and economics bar charts with Bar Graphs Solution

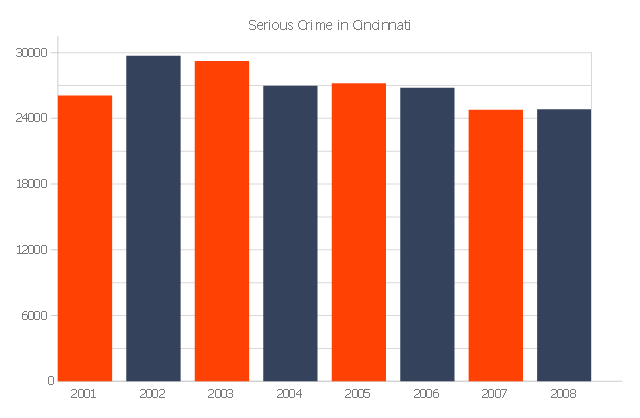
The bar graph example "Serious Crime in Cincinnati" was redesigned from the Commons Wikimedia file: Cincinnati-Part-1-Crimes.jpg.
[commons.wikimedia.org/ wiki/ File:Cincinnati-Part-1-Crimes.jpg]
"Before the riot of 2001, Cincinnati's overall crime rate was dropping dramatically and had reached its lowest point since 1992. After the riot violent crime increased. Reflecting national trends, crime rates in Cincinnati have dropped in all categories from 2006 to 2010." [Crime in Cincinnati. Wikipedia]
The bar graph example "Serious Crime in Cincinnati" was created using the ConceptDraw PRO diagramming and vector drawing software extended with the Bar Graphs solution from the Graphs and Charts area of ConceptDraw Solution Park.
www.conceptdraw.com/ solution-park/ charts-bar-graphs
Column graph
Bar Chart

Bar Diagrams for Problem Solving. Create business management bar charts with Bar Graphs Solution

Column Chart Software

Bar Diagrams for Problem Solving. Create event management bar charts with Bar Graphs Solution

 Divided Bar Diagrams
The Divided Bar Diagrams Solution extends the capabilities of ConceptDraw PRO v10 with templates, samples, and a library of vector stencils for drawing high impact and professional Divided Bar Diagrams and Graphs, Bar Diagram Math, and Stacked Graph.
Bar Diagrams for Problem Solving. Create economics and financial bar charts with Bar Graphs Solution

HelpDesk
How to Draw a Divided Bar Chart in ConceptDraw PRO

This double bar chart example was drawn on the base of picture "Nitrate Concentration (milligrams per liter; mg/ L) in Community Water Systems (CWS), Mean and Maximum by Year, New Mexico 1999-2012" from the New Mexico's Indicator-Based Information System (NM-IBIS) website.
"Nitrate toxicity is a preventable cause of methemoglobinemia (blue baby syndrome), especially in infants. Infants younger than 4 months of age are at greatest risk of toxicity from nitrate-contaminated drinking water.
These infants are more susceptible to developing methemoglobinemia because the pH of their gut is normally higher (less acidic) than in older children and adults. The higher pH enhances the conversion of ingested nitrate to the more toxic nitrite. The bacterial flora of a young infant's gut is also different from that found in older children and adults and might be more likely to convert ingested nitrate to nitrite. Gastroenteritis can increase body transformation of nitrate to nitrite and absorption into the bloodstream of nitrite from the large intestine.
A large proportion of hemoglobin in young infants is in the form of fetal hemoglobin. Fetal hemoglobin is more readily oxidized to methemoglobin (MHg) by nitrites than is adult hemoglobin. In addition, in infants, the enzyme (NADH-dependent methemoglobin reductase) responsible for reduction of formed MHg back to normal hemoglobin has only about half the activity it has in adults.
Symptoms such as shortness of breath and bluish skin coloring around the mouth, hands, or feet, can occur in infants rapidly over a period of days. If the condition is severe, it could lead to convulsions, coma, and even death, if untreated. Most older children and adults can take in larger amounts of nitrate without experiencing the same health effects as infants. However, pregnant women, nursing mothers, and people with low stomach acid conditions or those deficient in an enzyme that changes MHg back to normal hemoglobin are more susceptible to nitrate-induced methemoglobinemia and could be affected by water with nitrate levels above 10 mg/ L.
Adverse reproductive outcomes such as spontaneous abortions, intrauterine growth retardation, and various birth defects such as anencephaly have been reported in scientific literature from exposure to high nitrate levels in drinking water; however, the evidence is inconsistent.
Little is known about possible health effects from high nitrate level exposure over a long period of time. However, some studies suggest that there might be a risk of stomach, esophageal or bladder cancers in people with prolonged ingestion of high levels of nitrate. This might be due to the formation of nitrosoamines in the body following ingestion exposure to high levels of nitrate.
International Agency for Research on Cancer (IARC) classified ingested nitrate or nitrite as probably carcinogenic to humans (Group 2A) under conditions that result in formation of nitroso-compounds (e.g., nitrosoamines) in the body (endogenous nitrosation)." [ibis.health.state.nm.us/ indicator/ view/ CommWaterNitrates.MeanMax.Year.html]
The double bar graph example "Nitrate concentration in Community Water Systems (CWS)" was created using the ConceptDraw PRO diagramming and vector drawing software extended with the Bar Graphs solution from the Graphs and Charts area of ConceptDraw Solution Park.
Double bar graph
---double-bar-chart.png--diagram-flowchart-example.png)
Bar Charts

Stacked Graph

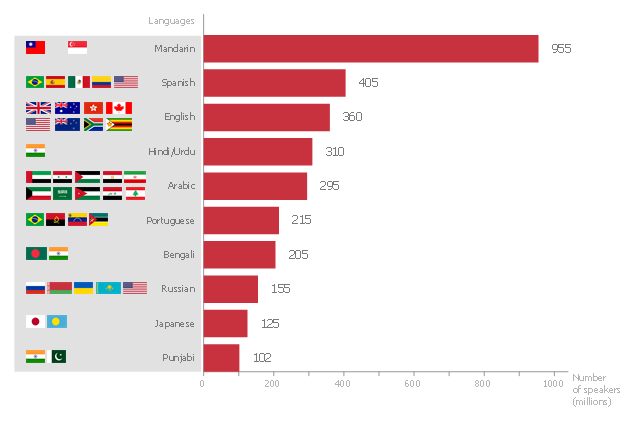
"In the philosophy of language, a natural language (or ordinary language) is any language which arises in an unpremeditated fashion as the result of the innate facility for language possessed by the human intellect. A natural language is typically used for communication, and may be spoken, signed, or written. Natural language is distinguished from constructed languages and formal languages such as computer-programming languages or the "languages" used in the study of formal logic, especially mathematical logic. ... Though the exact definition varies between scholars, natural language can broadly be defined in contrast on the one hand to artificial or constructed languages, computer programming languages like Python and international auxiliary languages like Esperanto, and on the other hand to other communication systems in nature, such as the waggle dance of bees. Although there are a variety of natural languages, any cognitively normal human infant is able to learn any natural language. By comparing the different natural languages, scholars hope to learn something about the nature of human intelligence and the innate biases and constraints that shape natural language, which are sometimes called universal grammar. The term "natural language" refers only a language that has developed naturally, and hence to actual speech, rather than prescribed speech. Hence, unstandardized speech (such as African American Vernacular English) is natural, whereas standardized speech such as Standard American English, which is in part prescribed, is somewhat artificial." [Natural language. Wikipedia]
The horizontal bar chart example "The most spoken languages of the world" was created using the ConceptDraw PRO diagramming and vector drawing software extended with the Bar Graphs solution from the Graphs and Charts area of ConceptDraw Solution Park.
www.conceptdraw.com/ solution-park/ charts-bar-graphs
Horizontal bar graph
- Sales Growth. Bar Graphs Example | Financial Comparison Chart ...
- Sales Growth. Bar Graphs Example | Sales Dashboard | Sales ...
- Sales Growth. Bar Graphs Example
- Bar Graphs | Sales Growth. Bar Graphs Example | Bar Graph | Bar ...
- Bar Graphs | Picture Graphs | Line Graphs | Graphs
- Bar Chart Examples | Bar Chart Software | Bar Graphs | Bar Graph
- Bar Graphs | Bar Graph | Sales Growth. Bar Graphs Example | Bar ...
- Sales Growth. Bar Graphs Example | Bar Diagrams for Problem ...
- Bar Chart Examples | Column Chart Examples | Bar Graphs
- Financial Comparison Chart | Sales Growth. Bar Graphs Example ...
- Sales Growth. Bar Graphs Example | Sales department - Vector ...
- Bar Chart Examples | Sales Growth. Bar Graphs Example | Financial ...
- Double bar graph template | Double bar chart - Changes in price ...
- Bar Chart Software | Bar Chart Examples | Column Chart Software
- Bar Graphs | Double bar chart - Changes in price indices | Bar ...
- Bar Graphs | Blank Scatter Plot | Basic Diagramming | Sample Bar ...
- Bar Chart Software | Column Chart Software | Bar Chart Examples
- Bar graph - Serious Crime in Cincinnati | Chart Examples | Column ...
- Create Graphs and Charts | Sales Growth. Bar Graphs Example ...
- Bar Chart Software | Sales Growth. Bar Graphs Example | Column ...