Process Flow Diagram Symbols

Chemical Engineering

Process Flow Diagram

Physical Security Plan

Process Flowchart


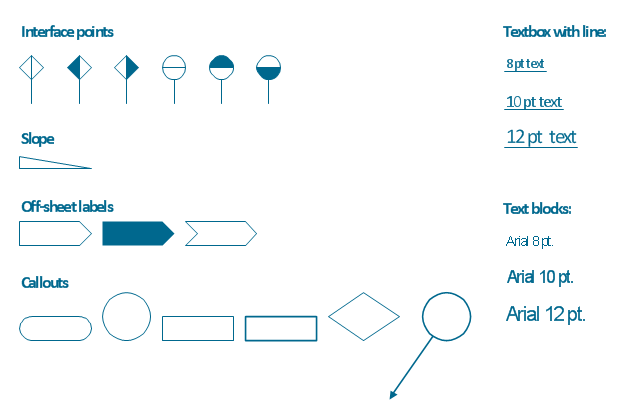
The vector stencils library "Process annotations" contains 22 symbols of interface points, slope, off-sheet labels, callouts and textboxes.
Use these shapes for setting automatic labels to display a datasheet field for a pipeline shape, labels, captions, outlines, off-sheet labels, text balloons, annotations, outlines, tags, and descriptions.
"In engineering a process is a set of interrelated tasks that, together, transform inputs into outputs. These tasks may be carried out by people, nature, or machines using resources; so an engineering process must be considered in the context of the agents carrying out the tasks, and the resource attributes involved. Systems Engineering normative documents and those related to Maturity Models are typically based on processes. For example, System Engineering processes of the EIA-632 and processes involved in the Capability Maturity Model Integration (CMMI) institutionalization and improvement approach. Constraints imposed on the tasks and resources required to implement them are essential for executing the tasks mentioned.
A chemical process is a series of unit operations used to produce a material in large quantities.
In the chemical industry, chemical engineers will use the following to define or illustrate a process:
Process Flow Diagram (PFD),
Piping and instrumentation diagram
(P&ID),
Simplified process description,
Detailed process description,
Project management,
Process simulation." [Process (engineering). Wikipedia]
The example "Design elements - Process annotations" was created using the ConceptDraw PRO diagramming and vector drawing software extended with the Chemical and Process Engineering solution from the Engineering area of ConceptDraw Solution Park.
Process annotation symbols
Process Flow Chart

Active Directory Network. Computer and Network Examples


Network Glossary Definition

Types of Flowcharts


 Chemical and Process Engineering
This chemical engineering solution extends ConceptDraw DIAGRAM.9.5 (or later) with process flow diagram symbols, samples, process diagrams templates and libraries of design elements for creating process and instrumentation diagrams, block flow diagrams (BFD
Technical Flow Chart

Create Flow Chart on Mac

Best Vector Drawing Application for Mac OS X

Mini Hotel Floor Plan. Floor Plan Examples

Value Stream Mapping Symbols

Multi Layer Venn Diagram. Venn Diagram Example

Diagramming Software for Design UML Interaction Overview Diagrams


ConceptDraw DIAGRAM Compatibility with MS Visio

Restaurant Floor Plans

- Process Flowchart
- How To Draw Bfd For Unit Operations
- Control Symbols And Units
- Process Flow Diagram | Example Basic Flowchart. Flowchart ...
- Chemical Engineering | Process Flow Diagram Symbols | Process ...
- Chemical Engineering | Chemical and Process Engineering ...
- Process Flow Diagram Symbols | Process flow diagram - Typical oil ...
- Process Flow Diagram Symbols | Flow Chart Symbols | Design ...
- Process Flowchart | Telecommunication Network Diagrams | Sales ...
- Symbols Of Chemical Engineering Flowchart Symbols For Plant
- Process Flowchart | Symbol Of Machining Operations
- Network Glossary Definition | Flowchart Showing All The Unit ...
- Mechanical Drawing Symbols | Mechanical Engineering | Process ...
- Process Flow Diagram Symbols | EXPRESS-G data Modeling ...
- Storage Tank Symbol In Flow Diagram
- Machining Operations Symbol In Drawing
- Design elements - HVAC controls | Design elements - Events BPMN ...
- Crude oil distillation unit - PFD | Process Engineering | Process Flow ...
- 2-bit ALU - Logic gate diagram | Computer network - Vector stencils ...