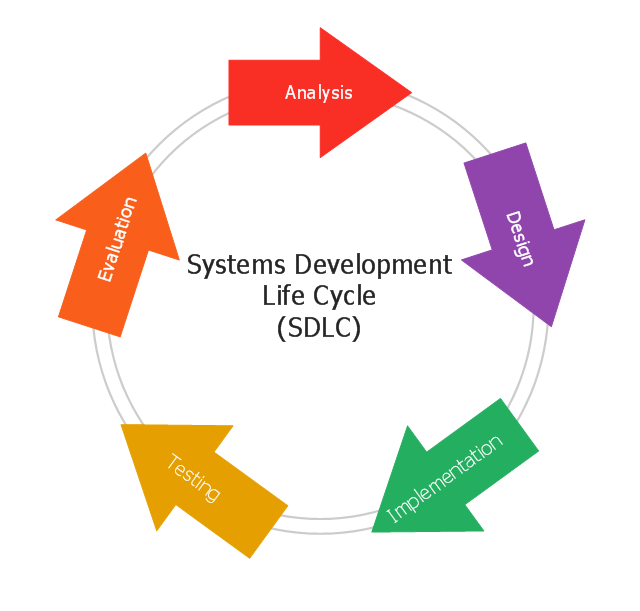
This circular arrows diagram sample shows the systems development life cycle (SDLC) stages.
"The systems development life cycle (SDLC), also referred to as the application development life-cycle, is a term used in systems engineering, information systems and software engineering to describe a process for planning, creating, testing, and deploying an information system. The systems development life-cycle concept applies to a range of hardware and software configurations, as a system can be composed of hardware only, software only, or a combination of both." [Systems development life-cycle. Wikipedia]
The arrow circle diagram example "Systems development life cycle" was created using the ConceptDraw PRO diagramming and vector drawing software extended with the Circular Arrows Diagrams solution from the area "What is a Diagram" of ConceptDraw Solution Park.
SSADM Diagram
The vector stencils library SSADM from the solution Systems engineering contains specific symbols of SSADM diagrams for ConceptDraw DIAGRAM diagramming and vector drawing software. The Systems engineering solution is contained in Software Development area of ConceptDraw Solution Park. The example below illustrates the waterfall model used in SSADM. This model involves 5 stages of developing a product such as requirements specification and its' analysis, design, coding and testing.How to Draw ER Diagrams
An Entity Relationship (ER) Diagram is a type of flowchart that illustrates the logical structure of databases, how the different entities, such as people, objects or concepts relate to each other within a given system. How to draw ER Diagrams fast and easy? ConceptDraw DIAGRAM diagramming and vector drawing software enhanced with Entity-Relationship Diagram (ERD) solution from Software Development area of ConceptDraw Solution Park offers you the powerful abilities of designing the ER Diagrams and ERD drawings without efforts. This solution includes a lot of predesigned icons advocated by popular Chen's and Crow’s Foot notations, which can be used when describing an enterprise database and depicting it by abstract way. Simply drag the required objects to ConceptDraw document, connect them in a desired way and make style settings. But the easiest and fastest way of drawing ERDs is to make them on the base of ready-to-use Chen ERD and Crow's Foot ERD templates, which are both represented at ConceptDraw STORE.
 Business Diagrams
The Business Diagrams Solution extends ConceptDraw DIAGRAM with an extensive collection of professionally designed illustrative samples and a wide variety of vector stencils libraries, which are the real help for all business-related people, business analysts, business managers, business advisers, marketing experts, PR managers, knowledge workers, scientists, and other stakeholders allowing them to design the bright, neat, expressive and attractive Bubble Diagrams, Circle-Spoke Diagrams, Circular Arrows Diagrams, and Venn Diagrams with different quantity of sets in just minutes; and then successfully use them in documents, reports, statistical summaries, and presentations of any style.
Use the Best FlowChart Tool for the Job
The ConceptDraw DIAGRAM is a best flow chart tool for the job. The samples and templates included in the basic set allows users to draw any type of a flowchart. The vector stencils created by designers give ability to draw great-looking flowchart. Flowcharts give to users the ability to represent structural data visually.Basic Diagramming
Try ConceptDraw program, the perfect drawing tool for creating all kinds of great-looking drawings, charts, graphs, and illustrations.
Building Drawing Software for Design Seating Plan
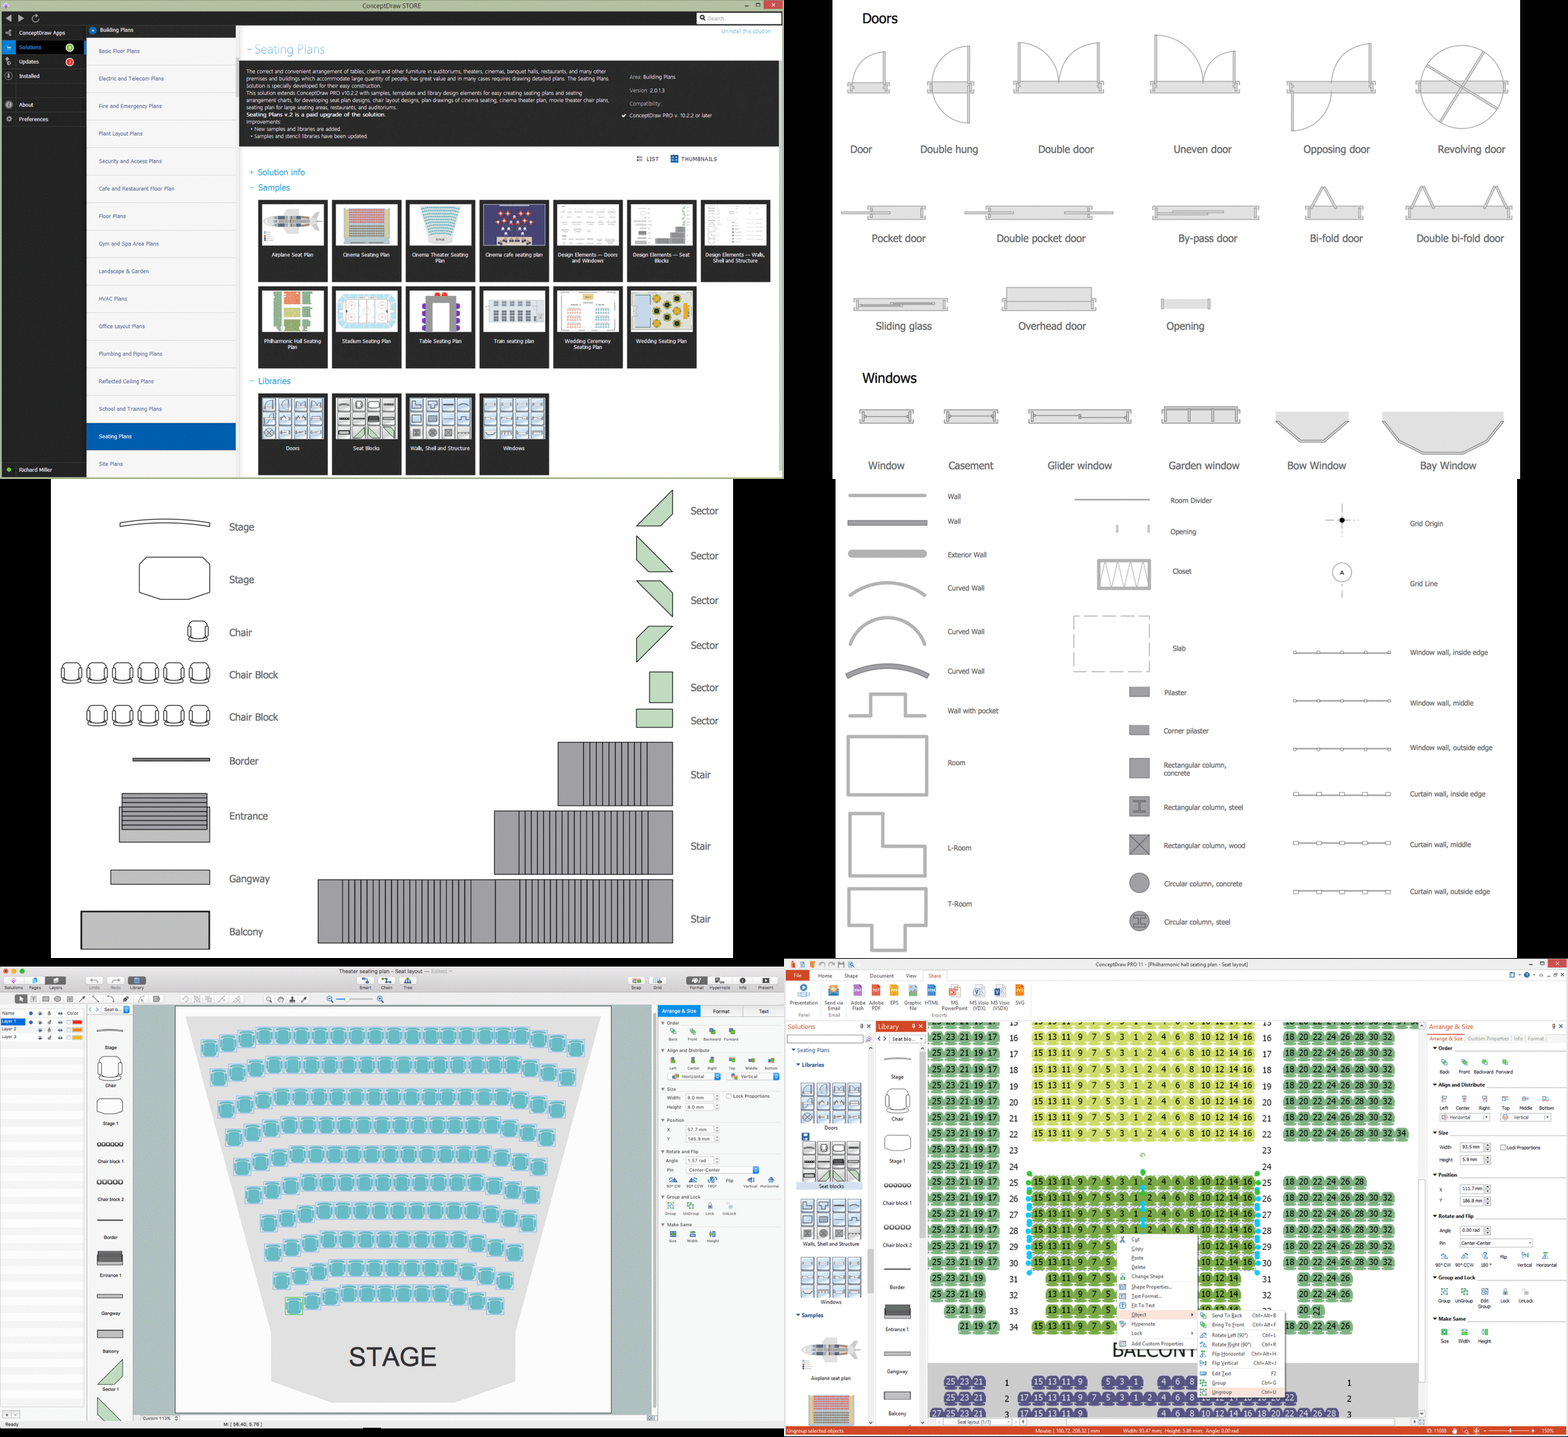
A Seating Plan is a scheme that illustrates the arrangement of seats on the plan of specific place. The seats can be located separately or grouped in rows like in stadiums. Usually they are numerated allowing spectators to choose them beforehand and have a guaranteed seat. It is especially useful for cinemas and theaters, where the places differ according to their price range. When all seatings are equal, it is used the open seating scheme and each client can choose any free seat. Each of these seating systems has many own advantages, it is also possible to mix them. Seating Plans, Schemes and Drawings are popular and widely used for purchase and sale the entering tickets to theatres, cinemas, stadiums, trains, airplanes, etc. They are also useful for beforehand planning and assignment the seats on weddings, banquets, and other events. ConceptDraw DIAGRAM enhanced with Seating Plans solution offers the helpful building drawing software tools for design Seating Plan using the predesigned templates and vector elements of doors, windows, walls, seats, etc.
Flow Diagrams
Flow diagrams is a diagram used for structuring complex system and visually representing a flow and interactions of elements in a system. ConceptDraw DIAGRAM diagramming and vector drawing software enhanced with Flowcharts Solution from the "Diagrams" Area of ConceptDraw Solution Park is perfect for easy drawing professional looking Flow Diagrams. For drawing Flow Diagrams the Flowcharts Solution provides: 2 libraries with commonly used predesigned vector objects - Flowchart library and Flowcharts Rapid Draw library; collection of Flow Diagrams samples; Basic Flowchart template.How to Draw a Computer Network Diagrams
ConceptDraw DIAGRAM enhanced with popular Computer Network Diagrams solution from Computer and Networks area of ConceptDraw Solution Park is a powerful vector graphics and computer network diagramming software. It includes templates, samples and 7 libraries with predesigned vector objects of computer network devices, computer peripheral devices, network hardware, external digital devices, internet symbols, logical symbols, to help IT professionals easily visualize network equipment, to draft and present computer and network installations. It assists create easy and even instantly Computer Network Diagrams of various types and complexity, design Wireless Network Schemes, Network Topologies Diagrams, Computer Network System Designs. The list of five the most popular practical applications of Computer Network Diagrams solution includes documentation, presentations, training, workflows, education. A represented video How to Draw a Computer Network Diagram will help to realize effectively your computer network design process.Flowchart Components
The ConceptDraw Flowchart component includes a set of samples and templates. This geathered as flowchart maker toolbox which focused on drawing flowcharts of any industry standards.Entity Relationship Diagram Examples
Creation of Entity-Relationship (ER) model is a visual representation the structure of a business database, where data equates to entities or objects, which are linked by defined relationships expressing dependencies and requirements. By the nature, the ER model is an abstract visualization, a first step in design process towards creating a logical and functional database. ConceptDraw DIAGRAM professional software gives the ability to effectively describe a database using the Entity-Relationship model. Included to ConceptDraw Solution Park, the Entity-Relationship Diagram (ERD) solution contains the set of predesigned vector icons advocated by Chen's and Crow’s Foot notations that both can be used for data modeling and describing a database. Entity-Relationship Diagram (ERD) solution includes also helpful templates and incredibly large collection of varied Entity Relationship Diagram examples and samples offered at ConceptDraw STORE. Each of them can be used to develop your own model of a database of arbitrary complexity.
Process Flow app for macOS
Use ConceptDraw DIAGRAM diagramming and business graphics software to draw your own flowcharts of computer algorithms.UML Use Case Diagram Example. Social Networking Sites Project
UML Diagrams Social Networking Sites Project. This sample was created in ConceptDraw DIAGRAM diagramming and vector drawing software using the UML Use Case Diagram library of the Rapid UML Solution from the Software Development area of ConceptDraw Solution Park. This sample shows the Facebook Socio-health system and is used at the projection and creating of the social networking sites.IDEF0 Visio
ConceptDraw DIAGRAM extended with IDEF0 Diagrams solution from the Software Development area of ConceptDraw Solution Park is a powerful diagramming and vector drawing IDEF0 software. All IDEF0 diagrams created in ConceptDraw DIAGRAM are vector graphic documents and can be reviewed, modified and converted to MS Visio XML format. To obtain the IDEF0 Visio documents from ConceptDraw DIAGRAM documents use the wide export possibilities of ConceptDraw DIAGRAM.Interior Design. Plumbing — Design Elements
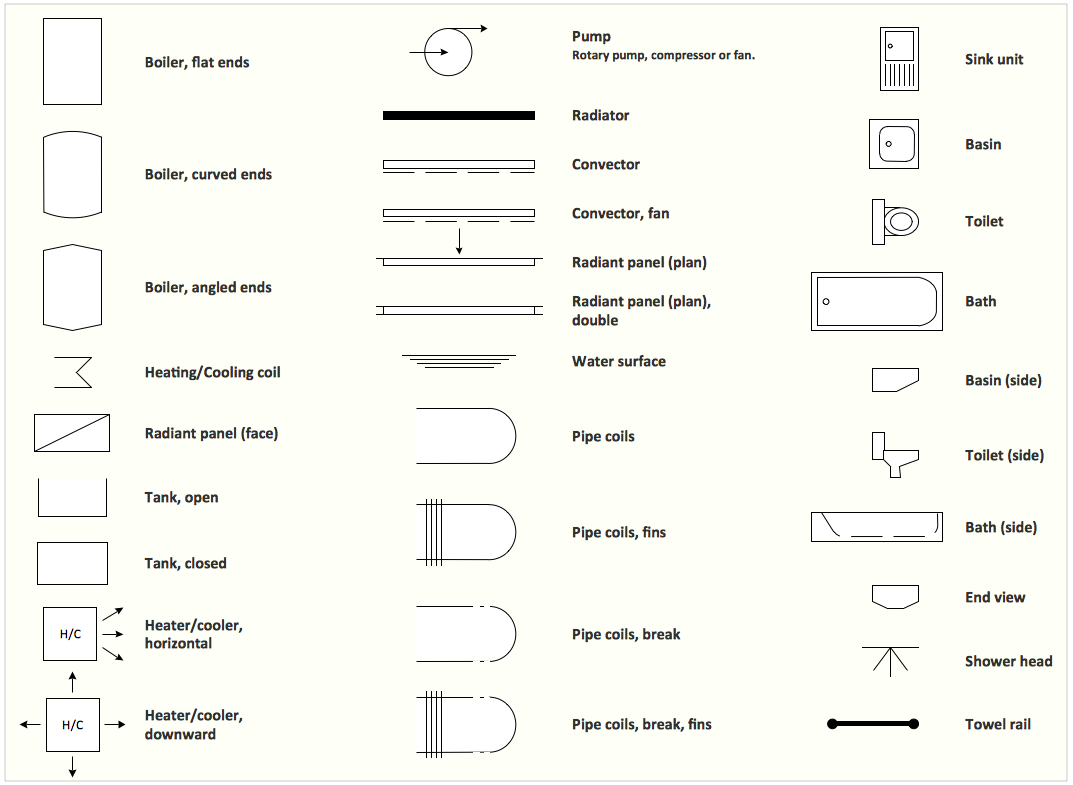
The plumbing system is a complex system of water supply pipes and drainpipes, sanitary equipment and drainage facilities, vent pipes and more. It supplies our homes, offices, hospitals, schools, business centers, and many other buildings with the main product for life - a water. For effective planning and montage the plumbing equipment, you need obligatory create and use different schematics of plumbing systems, the annotated plumbing diagrams, water lines and waste water plans. These diagrams are an obligatory part of any building project. They are used at all stages - construction, finishing works, interior design, and also during the exploitation of premises in cases of occurence some problems. Numerous libraries offered by the Plumbing and Piping Plans solution from Building Plans area of ConceptDraw Solution Park contain vector objects of plumbing components, sanitary equipment, bathroom fixtures, and many more for easy design the Plumbing and Piping plans, schematic diagrams and blueprints for hot and cold water supply systems, and waste water disposal systems.How to Draw an Organization Chart
An Organizational chart is a type of diagram which visually displays the structure of an organization, relationships and relative ranks of the organization′s parts and positions. Organizational chart is constructed as an hierarchical structure, in the form of tree. How to Draw an Organization Chart the most easy and quickly? The Organizational Charts solution, innovative Tree Auto-connection mode and ConceptDraw Arrows10 Technology included in ConceptDraw DIAGRAM software are powerful drawing tools that change the way of diagrams production. Arrows10 Technology provides smart behavior for the connectors, and so quick and precise placement when drawing, and lets easy make the changes and automatic rearrangement. It helps to make the process of drawing diagrams more efficient, easier and faster. Now, you don′t need to think on how to connect or place the objects, you can concentrate fully on what to draw. See obligatory the helpful video tutorial about creation the Organization Charts and orgchart professional presentations with ConceptDraw products.Processing Flow Chart
Processing Flow Chart is a simplified sketch which is used in chemical and process engineering for illustrating general plant streams, major equipments and key control loops.ConceptDraw DIAGRAM enhanced with Flowcharts Solution from the "Diagrams" Area of ConceptDraw Solution Park is a powerful Processing Flow Chart software which will help save lots of your time.
Personal area (PAN) networks. Computer and Network Examples
Personal area network (PAN) is a network organized on a limited area and used for data transmission between various personal devices, such as computers, tablets, laptops, telephones, different digital and mobile devices, etc. and also for connecting to higher level network and Internet. PAN is used to manage the interconnections of IT devices which surround a single user and generally contains such appliances, as cordless mice, keyboard, phone, and Bluetooth handsets. PANs can be wired with computer buses, or wirelessly connected to the Internet using such network technologies as Bluetooth, Z-Wave, ZigBee, IrDa, UWB, Body Area Network. PANs have a lot of pros and cons, they are expedient, lucrative and handy, but sometimes have bad connection with other networks on the same radio bands, Bluetooth has distance limits and slow data transfer speed, but is comparatively safe. ConceptDraw DIAGRAM diagramming software supplied with numerous solutions of Computer and Networks Area included to ConceptDraw Solution Park perfectly suits for designing the Personal Area Networks.
Workflow Diagram Software Mac
ConceptDraw DIAGRAM software is the best Mac software for drawing workflow diagrams. Its rich set of samples and templates, and specific features to draw diagrams faster make this software as comfortable as possible for drawing workflow diagrams. Use the ConceptDraw DIAGRAM professional Mac OS X software for drawing workflow diagram. The Workflow Diagrams solution with its libraries and templates set make the possibility to identify resources that are required for work goal implementation. The process flow diagram identify flow which occurs as network of process dependencies, organizational decisions and interactions between departments. Usually workflow diagrams show business participants actions that carry product or service to the final destination, the consumer.Electrical and Telecom Plan Software
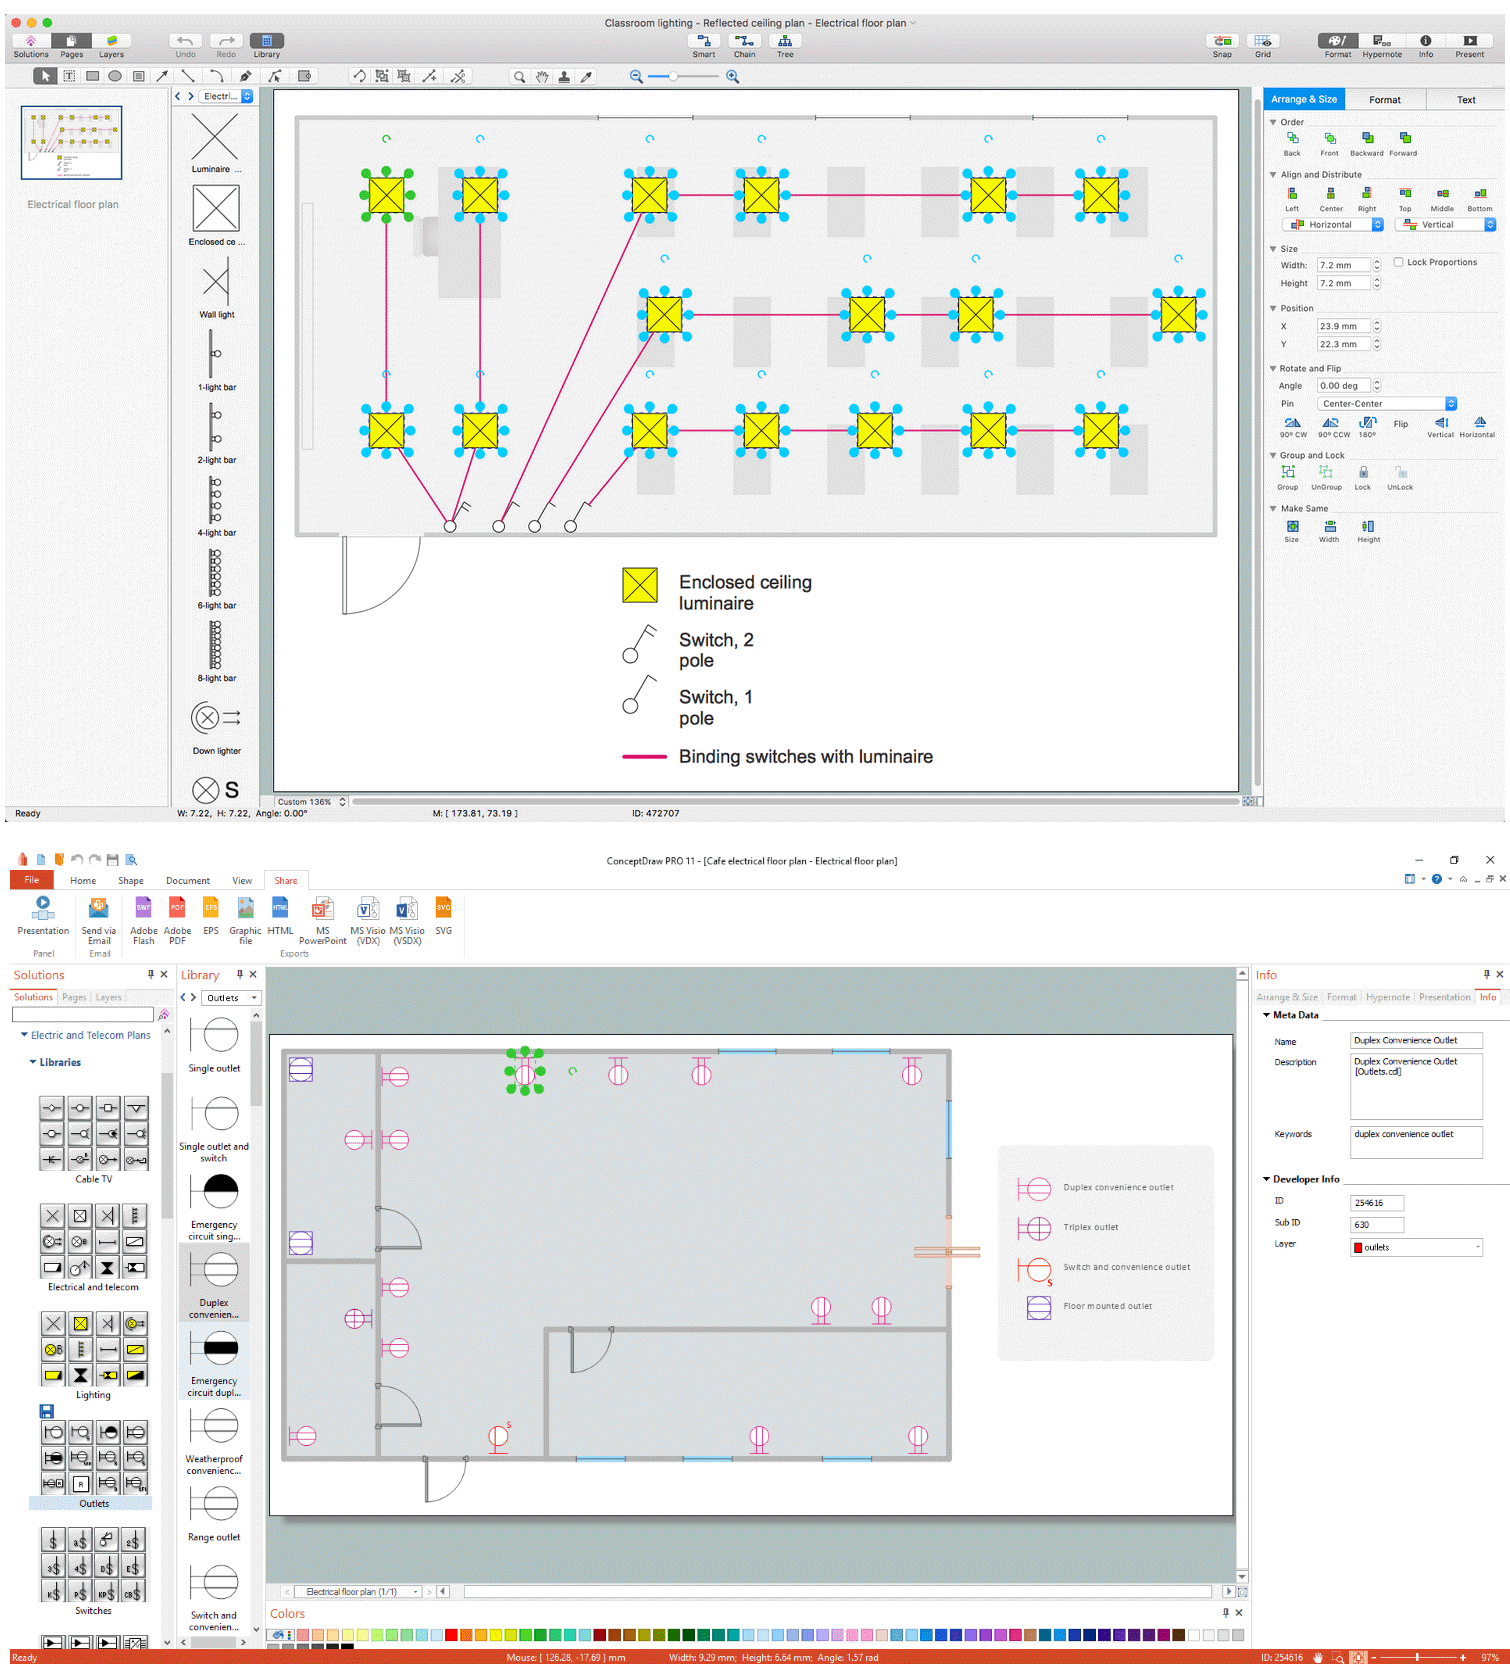
Electrical and Telecom Plans is an important part of architectural and engineering projects. They are technical drawings that display information about power, lighting, communication and telecommunication, and visually depict all electrical and telecom details including outlets, wires, circuit panels, etc. Created by architects, engineers, and designers, Electrical and Telecom Plans are necessary and obligatory for builders and electricians for correct installation electrical and telecom systems at different buildings, power plants, communication centers, electrical distribution systems, homes, flats, etc. ConceptDraw DIAGRAM with Electrical and Telecom Plans solution is a fast and effective way to draw: Electrical circuit diagrams, Electrical wiring diagrams, House electrical plans, Telecom plans, Control wiring diagrams, Power-riser diagrams, Reflected ceiling plans, Cabling layout schemes, Lighting panels layouts, etc. using vector symbols of electrical and telecommunication equipment, special symbols, lines, dimensions and notations.- Process Flowchart | JSD - Jackson system development | Systems ...
- Systems development life cycle | SSADM Diagram | Circular Flow ...
- Systems development life cycle | SSADM Diagram | Process ...
- Systems development life cycle | Explain System Development ...
- Systems development life cycle | Block Diagrams | Circular Arrows ...
- Systems development life cycle | Draw Diagram Of Information ...
- Process Flowchart | Systems development life cycle | JSD - Jackson ...
- Drawing System Development Cycle
- Systems development life cycle | Circular Arrows Diagrams | Block ...
- Model development life cycle - IDEF0 diagram | Circular Arrows ...
- Process Flowchart | Systems development life cycle | JSD - Jackson ...
- Systems development life cycle | Process Flowchart | JSD - Jackson ...
- Systems development life cycle
- Systems development life cycle | Software development with ...
- BPM life cycle | Systems development life cycle | Innovation life cycle ...
- Draw The System Development Cycle
- JSD - Jackson system development | Agile Methodology | ER ...
- Model development life cycle - IDEF0 diagram | Innovation life cycle ...
- Draw A Sgmple Sketch Of System Development Cycle
- Cycle Diagram Software


