Data Flow Diagram (DFD)

UML Flowchart Symbols

Data Flow Diagram

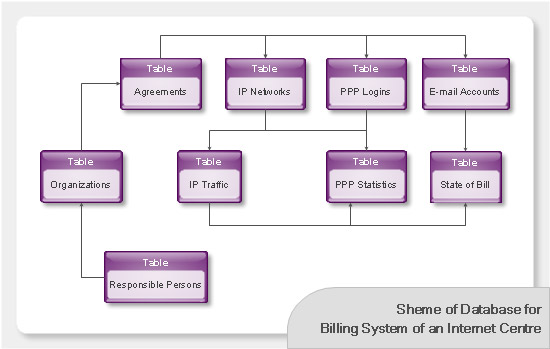
Databases Access Objects Model with ConceptDraw DIAGRAM
PDPC

"An ER model is an abstract way of describing a database. In the case of a relational database, which stores data in tables, some of the data in these tables point to data in other tables - for instance, your entry in the database could point to several entries for each of the phone numbers that are yours. The ER model would say that you are an entity, and each phone number is an entity, and the relationship between you and the phone numbers is 'has a phone number'. Diagrams created to design these entities and relationships are called entity–relationship diagrams or ER diagrams.
Using the three schema approach to software engineering, there are three levels of ER models that may be developed. ...
Conceptual data model ... is the highest level ER model in that it contains the least granular detail but establishes the overall scope of what is to be included within the model set.
Logical ER model ... contains more detail than the conceptual ER model. In addition to master data entities, operational and transactional data entities are now defined.
The physical ER model is normally developed to be instantiated as a database. Therefore, each physical ER model must contain enough detail to produce a database and each physical ER model is technology dependent since each database management system is somewhat different.
Physical model ... is normally forward engineered to instantiate the structural metadata into a database management system as relational database objects such as database tables, database indexes such as unique key indexes, and database constraints such as a foreign key constraint or a commonality constraint." [Entity–relationship model. Wikipedia]
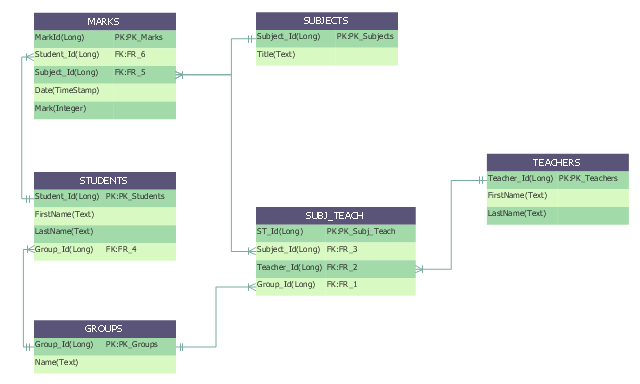
This crow's foot entity-relationship diagram (ERD) example "Educational data base" was created using the ConceptDraw PRO diagramming and vector drawing software extended with the Entity-Relationship Diagram (ERD) solution from the Software Development area of ConceptDraw Solution Park.
Using the three schema approach to software engineering, there are three levels of ER models that may be developed. ...
Conceptual data model ... is the highest level ER model in that it contains the least granular detail but establishes the overall scope of what is to be included within the model set.
Logical ER model ... contains more detail than the conceptual ER model. In addition to master data entities, operational and transactional data entities are now defined.
The physical ER model is normally developed to be instantiated as a database. Therefore, each physical ER model must contain enough detail to produce a database and each physical ER model is technology dependent since each database management system is somewhat different.
Physical model ... is normally forward engineered to instantiate the structural metadata into a database management system as relational database objects such as database tables, database indexes such as unique key indexes, and database constraints such as a foreign key constraint or a commonality constraint." [Entity–relationship model. Wikipedia]
This crow's foot entity-relationship diagram (ERD) example "Educational data base" was created using the ConceptDraw PRO diagramming and vector drawing software extended with the Entity-Relationship Diagram (ERD) solution from the Software Development area of ConceptDraw Solution Park.
ERD
Network Glossary Definition


Sales Process Flowchart Symbols

Network Diagram Software. LAN Network Diagrams. Physical Office Network Diagrams

Process Flow Chart

Model Based Systems Engineering

- 4 Level pyramid model diagram - Information systems types | 5 Level ...
- Diagram Chart For Organizing
- Examples of Flowcharts, Org Charts and More | Organizational ...
- The Organizational Planning Process With Diagram
- DFD Library System | Data Flow Diagrams (DFD) | Process ...
- Horizontal Org Flow Chart | Business Board Org Chart | How to Draw ...
- Examples of Flowcharts, Org Charts and More | Business Diagram ...
- 4 Level pyramid model diagram - Information systems types | Data ...
- HR management process - Flowchart | How to Draw an Organization ...
- Explain The Hierarchy Of Management And Draw Diagram
- Cross-Functional Flowchart (Swim Lanes) | Swim Lane Diagrams ...
- How to Draw a Chemical Process Flow Diagram | Examples of ...
- Classification Of Information System Flow Chart
- 4 Level pyramid model diagram - Information systems types ...
- How to Draw an Organization Chart | How to Draw an ...
- Horizontal Org Flow Chart | Cross-Functional Flowchart | Horizontal ...
- Structured Systems Analysis and Design Method (SSADM) with ...
- Horizontal Org Flow Chart | Horizontal Orgchart | ConceptDraw PRO ...
- UML Sample Project | UML Use Case Diagram Example Social ...
- Data Flow Diagrams (DFD) | DFD Library System | Process ...