A four level pyramid model of different types of Information Systems based on the different levels of hierarchy in an organization. The first level represents transaction processing systems for workers. The second level represents management information systems for middle managers. The third level represents decision support systems for senior menegers. The fourth level represents executive information systems for executives.
"The "classic" view of Information systems found in the textbooks in the 1980s was of a pyramid of systems that reflected the hierarchy of the organization, usually transaction processing systems at the bottom of the pyramid, followed by management information systems, decision support systems, and ending with executive information systems at the top. Although the pyramid model remains useful, since it was first formulated a number of new technologies have been developed and new categories of information systems have emerged, some of which no longer fit easily into the original pyramid model.
Some examples of such systems are:
data warehouses,
enterprise resource planning,
enterprise systems,
expert systems,
search engines,
geographic information system,
global information system,
office automation." [Information systems. Wikipedia]
This diagram was redesigned using the ConceptDraw PRO diagramming and vector drawing software from Wikimedia Commons file Four-Level-Pyramid-model.png. [commons.wikimedia.org/ wiki/ File:Four-Level-Pyramid-model.png]
This file is licensed under the Creative Commons Attribution-Share Alike 3.0 Unported license. [creativecommons.org/ licenses/ by-sa/ 3.0/ deed.en]
The triangle chart example "Information systems types" is included in the Pyramid Diagrams solution from the Marketing area of ConceptDraw Solution Park.
Pyramid diagram

A five level pyramid model of different types of Information Systems based on the information processing requirement of different levels in the organization. The first level represents transaction processing systems to process basic data. The second level represents office support systems to process information in office. The third level represents management information systems to process information by managers. The fourth level represents decision support systems to process explicit knowledge. The fifth level represents executive information systems to process tacit knowledge.
"A Computer(-Based) Information System is essentially an IS using computer technology to carry out some or all of its planned tasks. The basic components of computer based information system are:
(1) Hardware - these are the devices like the monitor, processor, printer and keyboard, all of which work together to accept, process, show data and information.
(2) Software - are the programs that allow the hardware to process the data.
(3) Databases - are the gathering of associated files or tables containing related data.
(4) Networks - are a connecting system that allows diverse computers to distribute resources.
(5) Procedures - are the commands for combining the components above to process information and produce the preferred output.
The first four components (hardware, software, database and network) make up what is known as the information technology platform. Information technology workers could then use these components to create information systems that watch over safety measures, risk and the management of data. These actions are known as information technology services." [Information systems. Wikipedia]
This pyramid diagram was redesigned using the ConceptDraw PRO diagramming and vector drawing software from Wikimedia Commons file Five-Level-Pyramid-model.png. [commons.wikimedia.org/ wiki/ File:Five-Level-Pyramid-model.png]
This file is licensed under the Creative Commons Attribution 3.0 Unported license. [creativecommons.org/ licenses/ by/ 3.0/ deed.en]
The triangle chart example "Information systems types" is included in the Pyramid Diagrams solution from the Marketing area of ConceptDraw Solution Park.
Pyramid diagram

HelpDesk
Event-driven Process Chain (EPC) Diagram Software

 IDEF0 Diagrams
IDEF0 Diagrams visualize system models using the Integration Definition for Function Modeling (IDEF) methodology. Use them for analysis, development and integration of information and software systems, and business process modelling.
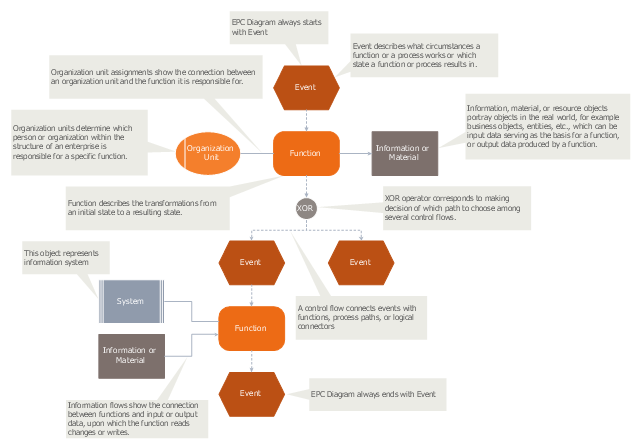
"An Event-driven Process Chain (EPC) is a type of flowchart used for business process modelling. Event-driven Process Chains can be used for configuring an enterprise resource planning (ERP) implementation, and for business process improvement. ...
Businesses use Event-driven Process Chain diagrams to lay out business process work flows, originally in conjunction with SAP R/ 3 modeling, but now more widely. It is used by many companies for modeling, analyzing, and redesigning business processes. The Event-driven Process Chain method was developed within the framework of Architecture of Integrated Information Systems (ARIS). As such it forms the core technique for modeling in ARIS, which serves to link the different views in the so-called control view." [Event-driven process chain. Wikipedia]
The event-driven process chain (EPC) diagram template for the ConceptDraw PRO diagramming and vector drawing software is included in the Event-driven Process Chain Diagrams solution from the Business Processes area of ConceptDraw Solution Park.
EPC diagram template
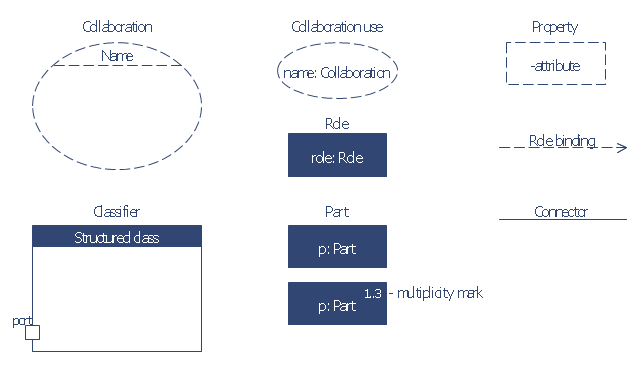
The vector stencils library "Bank UML composite structure diagram" contains 10 shapes for drawing UML composite structure diagrams.
Use it for object-oriented modeling of your bank information system.
"The key composite structure entities identified in the UML 2.0 specification are structured classifiers, parts, ports, connectors, and collaborations.
* Part : A part represents a role played at runtime by one instance of a classifier or by a collection of instances. The part may only name the role, it may name an abstract superclass, or it may name a specific concrete class. The part can include a multiplicity factor, such as the [0..*] shown for Viewer in the diagram.
* Port : A port is an interaction point that can be used to connect structured classifiers with their parts and with the environment. Ports can optionally specify the services they provide and the services they require from other parts of the system. In the diagram, each of the small squares is a port. Each port has a type and is labelled with a name... in the diagram. Ports may contain a multiplicity factor...
* Connector : A connector binds two or more entities together, allowing them to interact at runtime. The connector is shown as a line between some combination of parts, ports and structured classifiers. The diagram shows three connectors between ports, and one connector between a structured classifier and a part.
* Collaboration : A collaboration is generally more abstract than a structured classifier. It is shown as a dotted oval containing roles that instances can play in the collaboration.
* Structured classifier: A StructuredClassifier represents a class, often an abstract class, whose behavior can be completely or partially described through interactions between parts.
An EncapsulatedClassifier is a type of structured classifier that contains ports." [Composite structure diagram. Wikipedia]
This example of UML composite structure diagram symbols for the ConceptDraw PRO diagramming and vector drawing software is included in the ATM UML Diagrams solution from the Software Development area of ConceptDraw Solution Park.
UML composite structure diagram symbols
- 5 level pyramid model diagram of information systems types ...
- 4 Level pyramid model diagram - Information systems types | 5 Level ...
- Chart Of Management Information System With Diagram
- Data Flow Diagram | Process Flowchart | Types of Flowchart ...
- Diagramatic Function Of Information System
- Management Information System Block Diagram
- Function Model Diagram Template
- Why Flowchart Important to Accounting Information System ...
- How to Create Flowcharts for an Accounting Information System ...
- 4 Level pyramid model diagram - Information systems types ...
- Role Of Mis Withe Diagram
- System Context Diagram
- How to Create Flowcharts for an Accounting Information System ...
- 5 Level pyramid model diagram - Information systems types | 4 Level ...
- 3 Level pyramid model diagram - Information systems types
- 5 Level pyramid model diagram - Information systems types | 4 Level ...
- Data flow Model Diagram
- How To Draw Data Flow Diagram
- Context Diagram Template | Process Flowchart | Audiovisual system ...
- Pyramid Diagram | 5 Level pyramid model diagram - Information ...