PROBLEM ANALYSIS. Relations Diagram


Relationships Analysis

Competitor Analysis

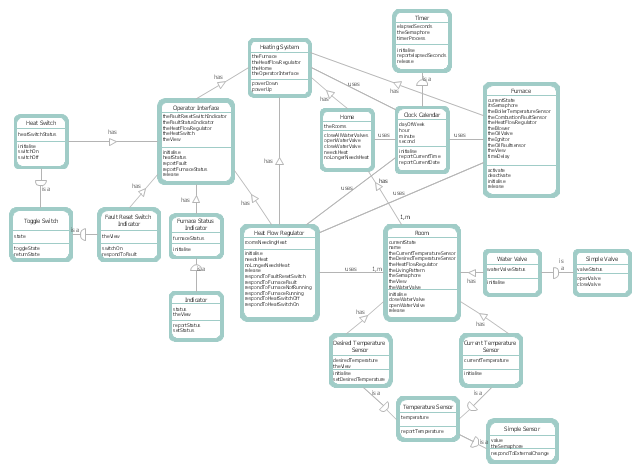
Yourdon and Coad Diagram

SWOT Analysis Solution - Strategy Tools

Total Quality Management Value

Structured Systems Analysis and Design Method (SSADM) with ConceptDraw DIAGRAM

 Fishbone Diagrams
The Fishbone Diagrams solution extends ConceptDraw DIAGRAM software with the ability to easily draw the Fishbone Diagrams (Ishikawa Diagrams) to clearly see the cause and effect analysis and also problem solving. The vector graphic diagrams produced using this solution can be used in whitepapers, presentations, datasheets, posters, and published technical material.
Pie Donut Chart. Pie Chart Examples

Remote Projects in Corporate Strategy


Pyramid Diagram

Communication Tool for Remote Project Management

This DFD sample was created on the base of the figure illustrating "A Survey of Object-Oriented Methods" by Peter Biggs from University of Durham.
[students.cs.byu.edu/ ~pbiggs/ images/ coadsys.gif]
"Object-oriented analysis and design (OOAD) is a popular technical approach to analyzing, designing an application, system, or business by applying the object-oriented paradigm and visual modeling throughout the development life cycles to foster better stakeholder communication and product quality.
According to the popular guide Unified Process, OOAD in modern software engineering is best conducted in an iterative and incremental way. Iteration by iteration, the outputs of OOAD activities, analysis models for OOA and design models for OOD respectively, will be refined and evolve continuously driven by key factors like risks and business values." [Object-oriented analysis and design. Wikipedia]
The DFD example "Coad/ Yourdon's Object-Oriented Analysis model" was created using the ConceptDraw PRO diagramming and vector drawing software extended with the Data Flow Diagrams solution from the Software Development area of ConceptDraw Solution Park.
DFD
ConceptDraw MINDMAP : Brainstorming, Mind Mapping for macOS and Windows

- Constant improvement of key performance indicators | TQM Diagram ...
- PROBLEM ANALYSIS . Identify and Structure Factors | Seven ...
- Coad/Yourdon's Object-Oriented Analysis model
- PROBLEM ANALYSIS . Root Cause Analysis Tree Diagram ...
- Sales KPI Dashboards | A KPI Dashboard Provides the Answers ...
- Yourdon and Coad Diagram | Coad/Yourdon's Object-Oriented ...
- Entity Relationship Diagram Symbols | PROBLEM ANALYSIS . Root ...
- How to Create an Effective Mind Map Using Topic Types | Think and ...
- What is a KPI? | How To Create the Interaction (Relation) Diagram ...
- Kpi Management Graphic
- Seven Management and Planning Tools | Seven Management and ...
- Mind Map Of The Factors Diagram
- Root cause analysis tree diagram - Manufacturing problem solution
- SWOT Matrix Template | SWOT analysis for a small independent ...
- Object-Oriented Design | Booch OOD Diagram | Coad/Yourdon's ...
- New business opportunity SWOT analysis matrix - Template portrait ...
- Constant improvement of key performance indicators | Performance ...
- Diagram For Information Fordecision Making
- A KPI Dashboard | A KPI Dashboard Provides the Answers Your ...
- Fishbone diagram - Template | Ishikawa diagram - Factors reducing ...