Basic Flowchart Symbols and Meaning
Flowchart Symbols and Meaning - Provides a visual representation of basic flowchart symbols and their proposed use in professional workflow diagram, standard process flow diagram and communicating the structure of a well-developed web site, as well as their correlation in developing on-line instructional projects. See flowchart's symbols by specifics of process flow diagram symbols and workflow diagram symbols.
HelpDesk
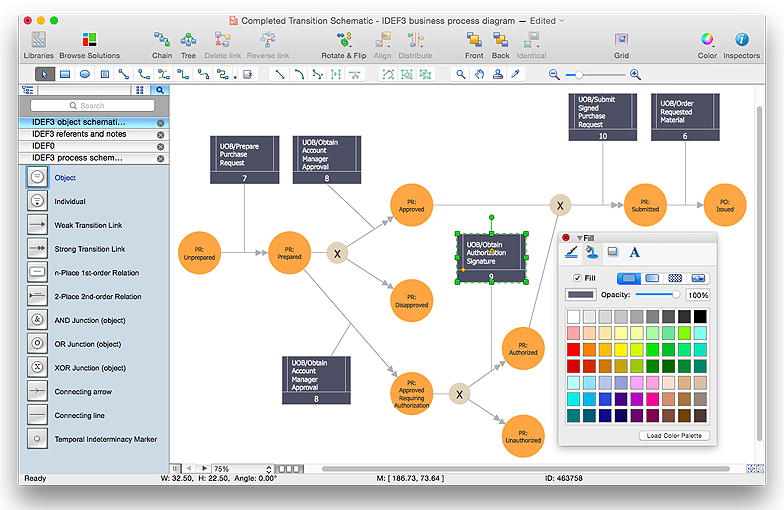
How to create an IDEF3 diagram using ConceptDraw PRO
IDEF3 is a member of the IDEF family of modeling methods that can be used to describe operations in a business process.An IDEF3 diagram provides a description of actual process flow within an organization or business, or the changes that occur to an object within that system. This method of knowledge capture is recorded in two different perspectives - users are able to create both process schematics and object schematics using the IDEF3 schematic symbols. ConceptDraw has created a solution that collects all symbols necessary to create professional IDEF3 diagrams. IDEF methodology is suitable for almost any form of business, and for anyone who needs to record enterprise architecture in a process driven manner. The IDEF Business Process Diagram solution and ConceptDraw PRO cater for these needs, giving both beginner and experienced users the tools they need to create effective business process diagrams.
Cross-Functional Flowchart
Cross-Functional Flowchart - to draw cross functional process maps is by starting with a cross-functional flowchart samples and templates. Easy to draw sample cross functional Process Flow Diagrams. Using a Cross-Functional flowchart is a clear way of showing each team member’s responsibilities and how processes get shared or transferred between different teams and departments.Use cross-functional flowcharts to show the relationship between a business process and the functional units (such as departments) responsible for that process. To create it use the best flowchart maker of ConceptDraw PRO.

Entity Relationship Diagram Examples
Creating an entity-relationship (ER) model is to visually represent the structure of a business database, where data equates to entities (or objects) that are linked by defined relationships expressing dependencies and requirements. By nature it is an abstract visualization, the first step in the design process towards creating a logical and functional database.ConceptDraw gives the ability to describe a database using the Entity-Relationship model. Entity-Relationship Diagram solution includes icons advocated by Chen's and Crow’s Foot notation that can be used when describing a database.

Business Process Flow Diagram
Business Process Flow Diagram is a graphical presentation of business processes and process flows. It is one of the main tool of business analysis and business process re-engineering that lets identify and easy understand process flows within organization.ConceptDraw PRO extended with Business Process Workflow Diagrams solution from the Business Processes area of ConceptDraw Solution Park is a powerful software which lets easy design Business Process Flow Diagram of any complexity.
Flowchart Examples and Templates
ConceptDraw provides a wide variety of examples such as flowcharts, organizational charts, business charts, and lots more. Please choose any examples you are interested in, alternatively download them for free; you will need to install ConceptDraw to view them. As you will see, ConceptDraw is very powerful, you can use more than 10000 symbols, examples, and many pre-drawn templates, to create your own spectacular flowcharts, business diagrams, and lots more, effortlessly, and in no time at all.
 ConceptDraw Solution Park
ConceptDraw Solution Park collects graphic extensions, examples and learning materials
Rainfall Bar Chart
This sample shows the Horizontal Bar Chart of the average monthly rainfalls.This sample was created in ConceptDraw PRO diagramming and vector drawing software using the Bar Graphs Solution from the Graphs and Charts area of ConceptDraw Solution Park.
 PM Meetings
PM Meetings solution extends ConceptDraw MINDMAP software with special tools, features, and templates, making the preparation for meetings of different orientation a quick and simple task, and allowing the project managers, team leaders, management specialists, and meeting organizers the capability to prepare easily and quickly for regular project meetings using solution's templates, to brainstorm ideas, to record brainstorming results, to keep the meetings on track, and to share meeting results immediately and without efforts. The meetings become more efficient because of the ability to easily record results, the collaborative team decisions are captured as a part of the meeting process, the meeting notes are easily distributed at a meeting’s conclusion to all participants and stakeholders.
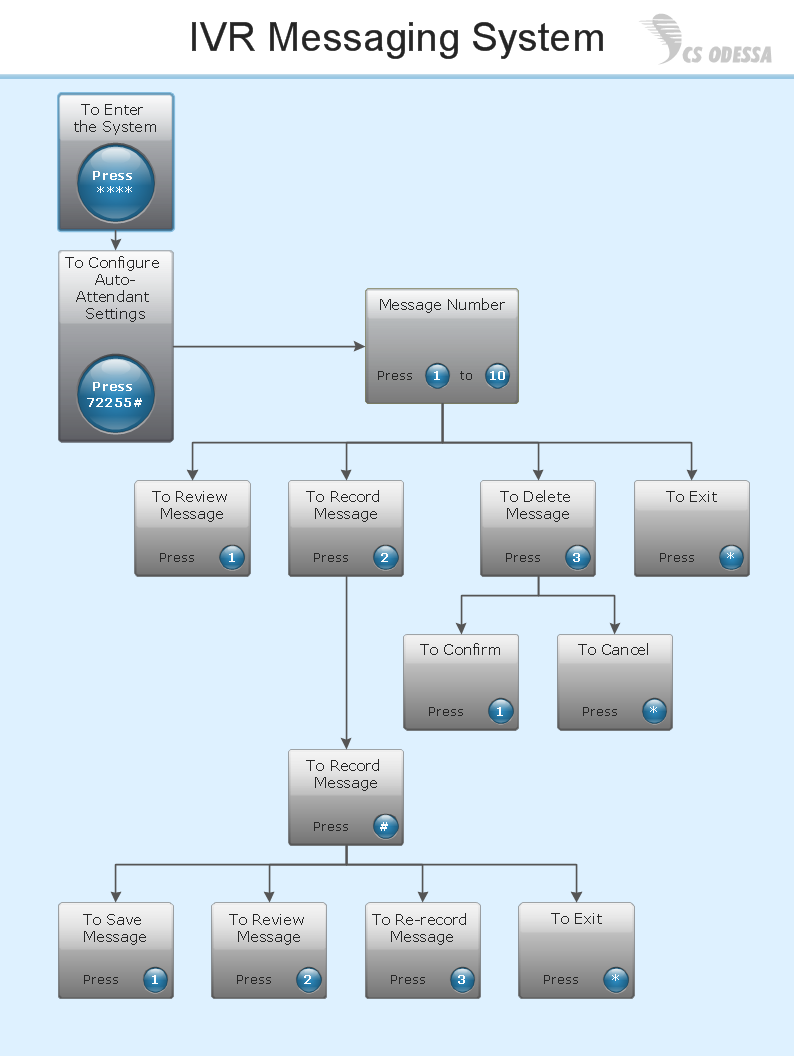
Interactive Voice Response Network Diagram
ConceptDraw solution Computer and Networks provides Interactive Voice Response samples, templates and library of 35 vector stencils for drawing the IVR network diagrams.Use ConceptDraw PRO diagramming and vector drawing software enhanced with solution Computer and Networks to visualize the logical and physical structure of IVR systems for inbound and outbound call centers and voice mail systems.

Bar Chart Template for Word
All these bar chart templates are included in the Bar Graphs solution.You can quickly rework these bar graph templates into your own charts by simply changing displayed data, title and legend texts.
Financial Comparison Chart
This sample shows the Bar Chart of the leverage ratios for two major investment banks. The leverage ratio is the ratio of the total debt to the total equity; it is a measure of the risk taken by the bank. The higher of the leverage ratio denotes the more risk, the greater risks can lead to the subprime crisis.Audit Process Flowchart. Audit Flowchart
Audit Process Flowchart, Audit Flowchart - Audit Flowcharts solution for ConceptDraw PRO Solution Park provides the Audit Flowcharts library with wide variety of predesigned audit flowchart symbols, and also the set of templates and samples allowing you design your own audit flowchart or audit process flowchart in one moment. Simply use any of offered samples and change it for your needs, or fill the desired template.- Product Record System Flowchart
- Diagramming Software for Design UML Collaboration Diagrams ...
- Drawing Of A Diagram Of Record Lifecycle
- Project management life cycle - Flowchart | Basic Diagramming ...
- Any Products Business Diagram
- UML Activity Diagram | Diagramming Software for Design UML ...
- Process Flowchart | Basic Flowchart Symbols and Meaning | Flow ...
- Product life cycle process - Flowchart | BPM life cycle | Innovation life ...
- Invoice payment process - Flowchart | Accounting Flowchart ...
- Products Business Diagram
- Flowchart Marketing Process. Flowchart Examples | Flow chart ...
- How To Create CCTV Network Diagram | CCTV Network Example ...
- Product Proposal Template | Product Proposal Documents ...
- Create Block Diagram | Block Diagram | SSADM Diagram | System ...
- Invoice payment process - Flowchart | Application handling and ...
- National Preparedness Cycle - Arrow ring chart | Program to Make ...
- Flow chart Example. Warehouse Flowchart | Identifying Quality ...
- IVR customer service hotline diagram | Process Flowchart | Example
- Process Flowchart | How to Draw a Line Graph | Marketing diagrams ...
- Innovation life cycle - Arrow loop diagram | Circular arrows diagram ...
- ERD | Entity Relationship Diagrams, ERD Software for Mac and Win
- Flowchart | Basic Flowchart Symbols and Meaning
- Flowchart | Flowchart Design - Symbols, Shapes, Stencils and Icons
- Flowchart | Flow Chart Symbols
- Electrical | Electrical Drawing - Wiring and Circuits Schematics
- Flowchart | Common Flowchart Symbols
- Flowchart | Common Flowchart Symbols


