Structured Systems Analysis and Design Method (SSADM) with ConceptDraw DIAGRAM

"A payment is the transfer of an item of value from one party (such as a person or company) to another in exchange for the provision of goods, services or both, or to fulfill a legal obligation. ...
Payment methods.
There are two types of payment methods; exchanging and provisioning. Exchanging is to change coin, money and banknote in terms of the price. Provisioning is to transfer money from one account to another. In this method, a third party must be involved. Credit card, debit card, Cheques, money transfers, and recurring cash or ACH (Automated Clearing House) disbursements are all electronic payments methods. Electronic payments technologies are magnetic stripe card, smartcard, contactless card and mobile handset. Mobile handset based payments are called mobile payments." [Payment. Wikipedia]
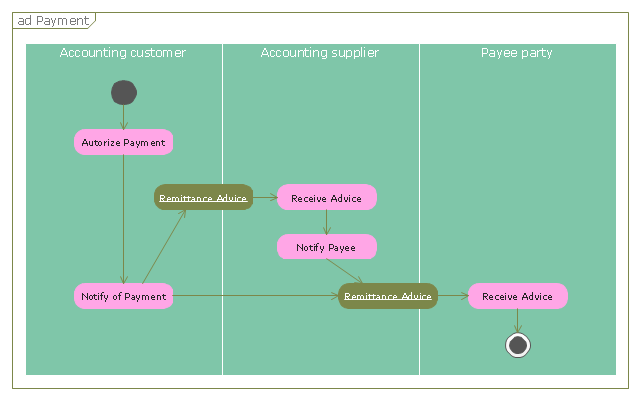
The UML activity diagram example "Payment process" was created using the ConceptDraw PRO diagramming and vector drawing software extended with the Rapid UML solution from the Software Development area of ConceptDraw Solution Park.
Payment methods.
There are two types of payment methods; exchanging and provisioning. Exchanging is to change coin, money and banknote in terms of the price. Provisioning is to transfer money from one account to another. In this method, a third party must be involved. Credit card, debit card, Cheques, money transfers, and recurring cash or ACH (Automated Clearing House) disbursements are all electronic payments methods. Electronic payments technologies are magnetic stripe card, smartcard, contactless card and mobile handset. Mobile handset based payments are called mobile payments." [Payment. Wikipedia]
The UML activity diagram example "Payment process" was created using the ConceptDraw PRO diagramming and vector drawing software extended with the Rapid UML solution from the Software Development area of ConceptDraw Solution Park.
UML activity diagram
Why Flowchart Important to Accounting Information System?

Data Flow Diagram

Booch OOD Diagram

Flow Diagram Software

Gane Sarson Diagram

Software Work Flow Process in Project Management with Diagram

This sample shows the Workflow Diagram that clearly illustrates stages a BPM consists of and relations between all parts of business. The Workflow Diagrams are used to represent the transferring of data during the work process, to study and analysis the working processes, and to optimize a workflow.
Draw Network Diagram based on Templates and Examples


Lean Six Sigma Diagram Software

Accounting Flowchart Purchasing Receiving Payable and Payment

Diagram Flow Chart

UML Class Diagram Generalization Example UML Diagrams

Definition TQM Diagram

Pyramid Diagram

- Payment Method Activity Diagram
- UML activity diagram - Payment process
- UML activity diagram - Payment process | Credit Card Processing ...
- Invoice payment process - Flowchart | UML activity diagram ...
- Payment Process Data Flow Chart
- Payment process | UML activity diagram
- UML activity diagram - Payment process | Data flow diagram (DFD ...
- UML activity diagram - Payment process | UML component diagram ...
- UML activity diagram - Payment process | UML Diagram Types List ...
- UML activity diagram - Payment process | Contactless Card
- Workflow Diagram | UML activity diagram - Payment process | Credit ...
- UML activity diagram - Payment process | ATM UML Diagrams ...
- UML activity diagram - Payment process | UML Tool & UML Diagram ...
- UML use case diagram - Banking system | UML activity diagram ...
- UML activity diagram - Payment process | Cross-Functional ...
- Payment Flow Diagram
- UML activity diagram (swimlanes) - Template | UML Diagram | UML ...
- Example of DFD for Online Store (Data Flow Diagram ) DFD ...
- Credit Card Processing System UML Diagram | UML activity ...