 Marketing
This solution extends ConceptDraw DIAGRAM and ConceptDraw MINDMAP with Marketing Diagrams and Mind Maps (brainstorming, preparing and holding meetings and presentations, sales calls).
Business Diagram Software


Bubble diagrams with ConceptDraw DIAGRAM

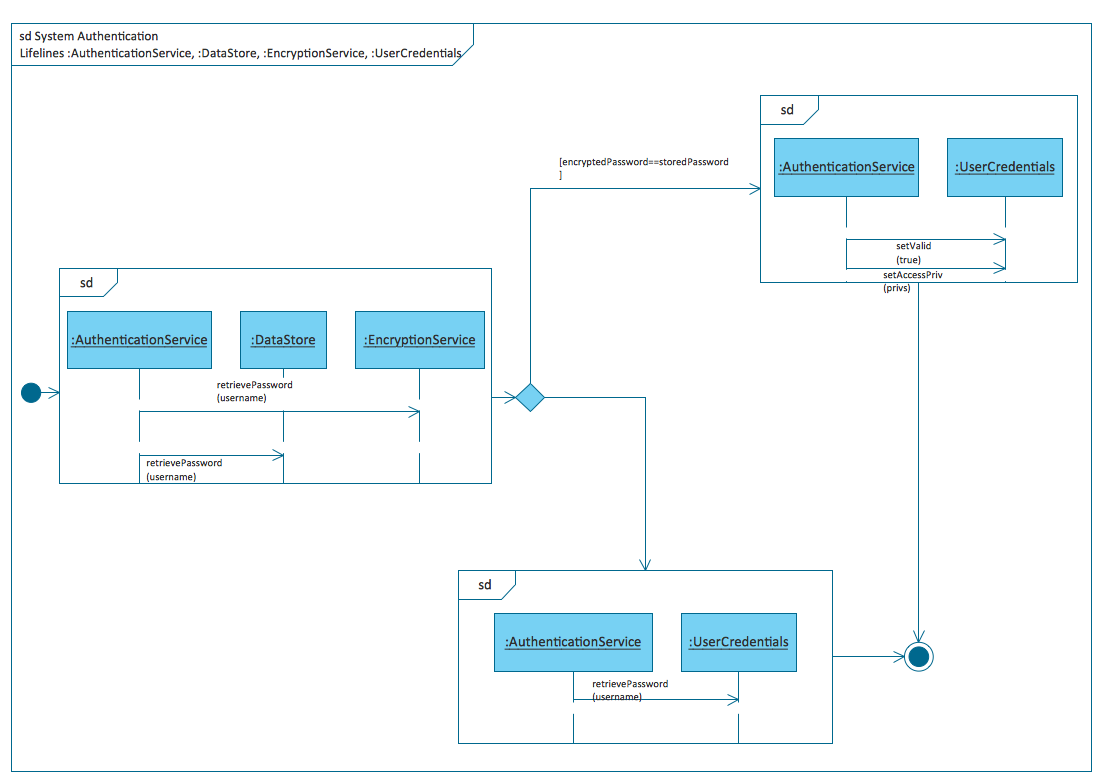
UML Business Process

HelpDesk
How to Draw a Fishbone Diagram

Management Tools — Total Quality Management

Fishbone Diagram Procedure

Multi Layer Venn Diagram. Venn Diagram Example

Introductory Guide to Rapid UML Solution
Brainstorm Exchanging Mind Maps with Evernote
ConceptDraw MINDMAP : Brainstorming, Mind Mapping for macOS and Windows

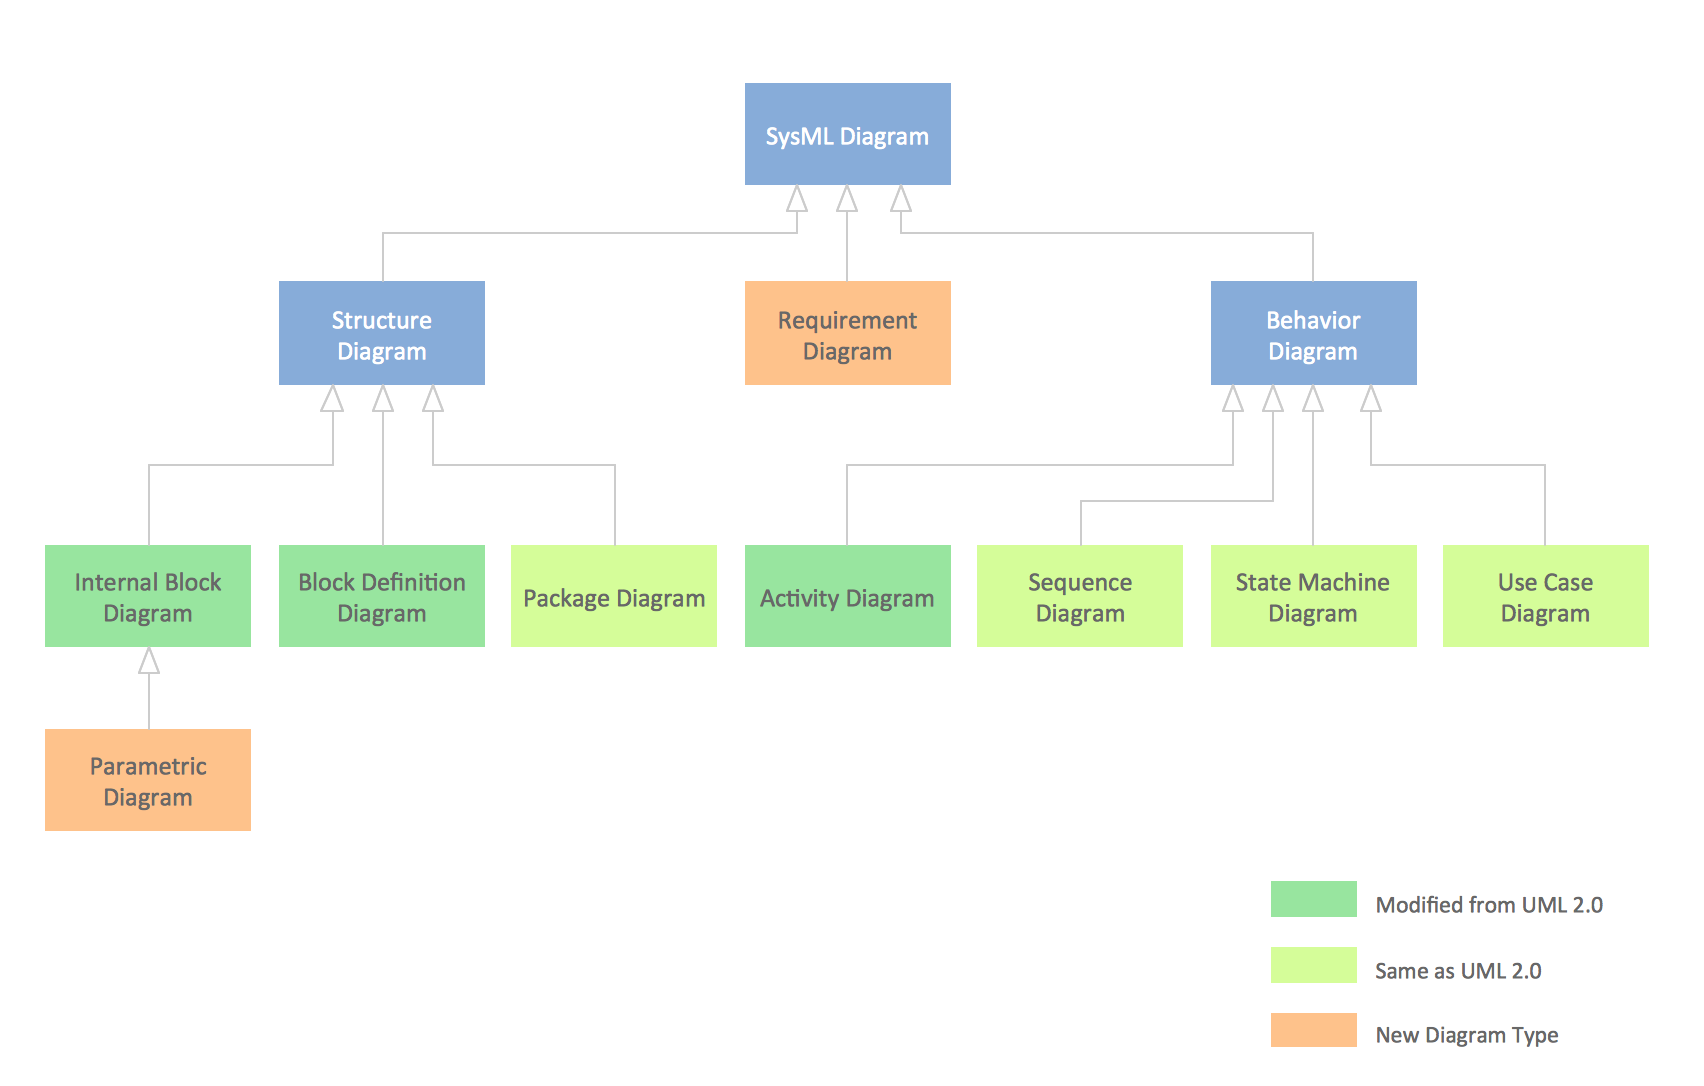
SysML Diagram
Software development with ConceptDraw products

Brainstorming in ConceptDraw MINDMAP
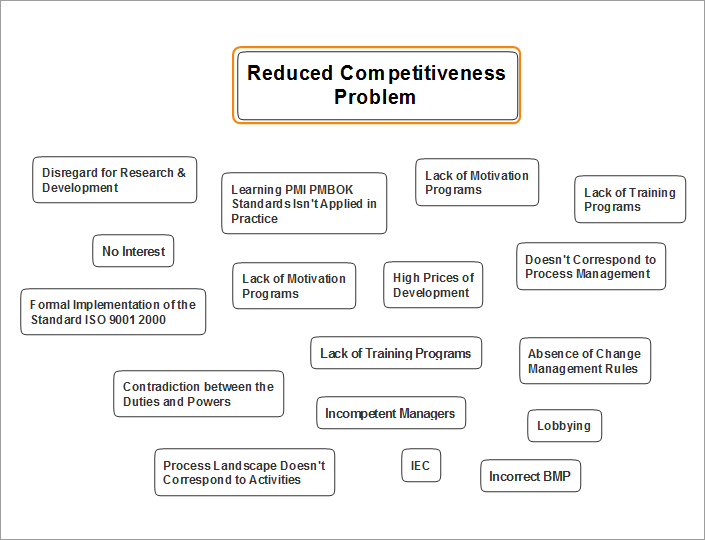
Cause and Effect Analysis

 PM Meetings
PM Meetings solution extends ConceptDraw MINDMAP software with special tools, features, and templates, making the preparation for meetings of different orientation a quick and simple task, and allowing the project managers, team leaders, management specialists, and meeting organizers the capability to prepare easily and quickly for regular project meetings using solution's templates, to brainstorm ideas, to record brainstorming results, to keep the meetings on track, and to share meeting results immediately and without efforts. The meetings become more efficient because of the ability to easily record results, the collaborative team decisions are captured as a part of the meeting process, the meeting notes are easily distributed at a meeting’s conclusion to all participants and stakeholders.
Examples of Flowcharts, Org Charts and More


Affinity Diagram

- Marketing | Business Productivity Diagramming | Business ...
- Business Diagram Software | ConceptDraw PRO ER Diagram Tool ...
- Marketing | Business Diagram Software | ConceptDraw PRO ER ...
- Pyramid Diagram and Pyramid Chart | Chart Examples | Bar Chart ...
- How to Make a Project Tasks Mind Map from Brainstorm | How to ...
- Diagram Software
- Bubble diagrams with ConceptDraw PRO | How to Draw a Bubble ...
- Marketing mix - Wheel diagram | Target market - Onion diagram ...
- Management | Total Quality Management Business Diagram | Total ...
- Venn diagram - Relationship marketing | Ladder of customer loyalty ...
- How To Create a Bubble Chart | Bubble diagrams in Landscape ...
- Affinity diagram template
- Marketing Diagrams | Marketing | Marketing Analysis Diagram ...
- Bubble diagrams with ConceptDraw PRO
- Timeline Diagrams | Management | Marketing | Concept Draw Pro ...
- Marketing | Seven Management and Planning Tools | Entity ...
- Total Quality Management TQM Diagrams | Pyramid Diagram ...
- Fishbone Diagram | Sales KPI Dashboards | Marketing | Fishbone ...
- Seven Management and Planning Tools | Affinity diagram template ...
- Cross-Functional Flowchart (Swim Lanes) | Build Strategies ...