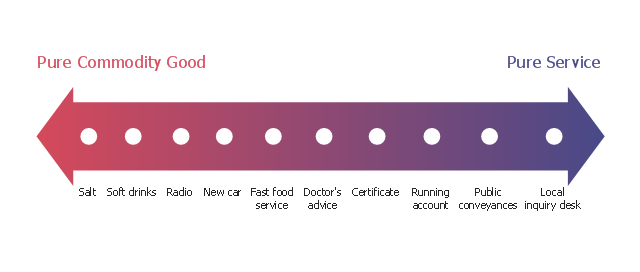
This marketing diagram sample depicts service-goods continuum.
"The dichotomy between physical goods and intangible services is an oversimplification; these are not discrete categories. Most business theorists see a continuum with pure service at one endpoint and pure commodity goods at the other endpoint. Most products fall between these two extremes. Goods are normally structural and can be transferred in an instant while services are delivered over a period of time. Goods can be returned while a service once delivered cannot. Goods are not always tangible and may be virtual." [Goods and services. Wikipedia]
The marketing chart example "Service-goods continuum diagram" was created using the ConceptDraw PRO diagramming and vector drawing software extended with the Marketing Diagrams solution from the Marketing area of ConceptDraw Solution Park.
Marketing chart
This circular diagram sample was created on the base of the figure from the Florence-Darlington Technical College website. [bus.fdtc.edu/ sbed/ core/ core7.html]
"A marketing plan may be part of an overall business plan. Solid marketing strategy is the foundation of a well-written marketing plan. While a marketing plan contains a list of actions, a marketing plan without a sound strategic foundation is of little use. ...
A marketing plan for a small business typically includes Small Business Administration Description of competitors, including the level of demand for the product or service and the strengths and weaknesses of competitors:
(1) Description of the product or service, including special features.
(2) Marketing budget, including the advertising and promotional plan.
(3) Description of the business location, including advantages and disadvantages for marketing.
(4) Pricing strategy.
(5) Market Segmentation." [Marketing plan. Wikipedia]
The circular diagram example "Marketing plan" was created using the ConceptDraw PRO diagramming and vector drawing software extended with the Target and Circular Diagrams solution from the Marketing area of ConceptDraw Solution Park.
www.conceptdraw.com/ solution-park/ marketing-target-and-circular-diagrams
Circular diagram

Flowchart Marketing Process. Flowchart Examples

 Marketing Diagrams
Marketing Diagrams solution extends ConceptDraw DIAGRAM diagramming software with abundance of samples, templates and vector design elements intended for easy graphical visualization and drawing different types of Marketing diagrams and graphs, including Branding Strategies Diagram, Five Forces Model Diagram, Decision Tree Diagram, Puzzle Diagram, Step Diagram, Process Chart, Strategy Map, Funnel Diagram, Value Chain Diagram, Ladder of Customer Loyalty Diagram, Leaky Bucket Diagram, Promotional Mix Diagram, Service-Goods Continuum Diagram, Six Markets Model Diagram, Sources of Customer Satisfaction Diagram, etc. Analyze effectively the marketing activity of your company and apply the optimal marketing methods with ConceptDraw DIAGRAM software.
Copying Service Process Flowchart. Flowchart Examples

Marketing Flow Chart

Pyramid Chart Examples

This marketing diagram sample illustrates leaky bucket model.
"The leaky bucket theory. The leaky bucket theory is the model that seeks to describe the process of customer gain and loss, otherwise known as customer churn. Customer retention is one of the key concepts in relationship marketing. Most companies concentrate on recruiting new customers to replace customers who move on, rather than seeking to retain customers." [Blythe J. Key Concepts in Marketing. 2009. knowledge.sagepub.com/ view/ key-concepts-in-marketing/ n5.xml]
"Customer attrition, also known as customer churn, customer turnover, or customer defection, is the loss of clients or customers.
Banks, telephone service companies, Internet service providers, pay TV companies, insurance firms, and alarm monitoring services, often use customer attrition analysis and customer attrition rates as one of their key business metrics (along with cash flow, EBITDA, etc.) because the "...cost of retaining an existing customer is far less than acquiring a new one." Companies from these sectors often have customer service branches which attempt to win back defecting clients, because recovered long-term customers can be worth much more to a company than newly recruited clients." [Customer attrition. Wikipedia]
The chart example "Leaky bucket diagram" was created using the ConceptDraw PRO diagramming and vector drawing software extended with the Marketing Diagrams solution from the Marketing area of ConceptDraw Solution Park.
Marketing chart

Workflow Application

"Causes in the diagram are often categorized, such as to ...
The 7 Ps (used in marketing industry):
(1) Product/ Service;
(2) Price;
(3) Place;
(4) Promotion;
(5) People/ personnel;
(6) Positioning;
(7) Packaging. " [Ishikawa diagram. Wikipedia]
This 8 Ps Ishikawa diagram (service cause and effect diagram) template is included in the Fishbone Diagram solution from the Management area of ConceptDraw Solution Park.
8Ps fishbone diagram

"Ecosystems represent sources of natural capital and provide goods and services to society, also called ecosystem services. The Millennium Ecosystem Assessment identified over 24 ecosystem services that can be divided up into 4 general groups including: 1) provisioning, 2) supporting, 3) regulating and 4) cultural." [User:Sawtoothgirl/ Sustainable Real Estate Development. Wikipedia]
"Humankind benefits in a multitude of ways from ecosystems. Collectively, these benefits are known as ecosystem services. Ecosystem services are regularly involved in the provisioning of clean drinking water and the decomposition of wastes. While scientists and environmentalists have discussed ecosystem services implicitly for decades, these the ecosystem services concept itself was popularized by the Millennium Ecosystem Assessment (MA) in the early 2000s. This grouped ecosystem services into four broad categories: provisioning, such as the production of food and water; regulating, such as the control of climate and disease; supporting, such as nutrient cycles and crop pollination; and cultural, such as spiritual and recreational benefits. To help inform decision-makers, many ecosystem services are being assigned economic values." [Ecosystem services. Wikipedia]
The segmented pyramid diagram example "Ecosystem goods and services" was redesigned using the ConceptDraw PRO diagramming and vector drawing software from Wikimedia Commons file ES_ triangle.png.
[commons.wikimedia.org/ wiki/ File:ES_ triangle.png]
This file is licensed under the Creative Commons Attribution-Share Alike 3.0 Unported license. [creativecommons.org/ licenses/ by-sa/ 3.0/ deed.en]
This segmented pyramid diagram example "Ecosystem goods and services" is included in the Pyramid Diagrams solution from the Marketing area of ConceptDraw Solution Park.
Pyramid diagram

Pyramid Diagram

 Customer Journey Mapping
Customer Journey Mapping Solution for ConceptDraw DIAGRAM opens incredibly broad opportunities for marketing and business specialists, product managers, designers, engineers, and other people interested in business development, increasing the product’s audience, its success and users' demand, providing them with capabilities of customer journey mapping. The included diagramming and customer journey mapping tools, predesigned vector customer journey mapping icons and charts, consumer journey mapping connectors, user journey and customer mapping figures, customer experience map icons and touchpoint icons, quick-start templates and samples provide excellent conditions for the customer journey mapping process, for creating Customer Journey Map and Customer Experience Map.
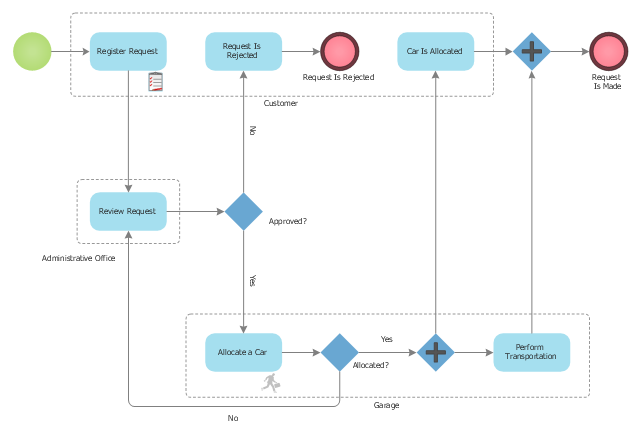
This BPMN (Business Process Model and Notation) diagram sample represents the taxi service order procedure workflow.
"A business process or business method is a collection of related, structured activities or tasks that produce a specific service or product (serve a particular goal) for a particular customer or customers. It often can be visualized with a flowchart as a sequence of activities with interleaving decision points or with a Process Matrix as a sequence of activities with relevance rules based on data in the process. ...
There are three types of business processes:
(1) Management processes, the processes that govern the operation of a system. Typical management processes include "corporate governance" and "strategic management".
(2) Operational processes, processes that constitute the core business and create the primary value stream. Typical operational processes are purchasing, manufacturing, advertising and marketing, and sales.
(3) Supporting processes, which support the core processes. Examples include accounting, recruitment, call center, technical support. ...
The ... improvement areas are equally applicable to policies, processes and detailed procedures (sub-processes/ tasks). There is a cascading effect of improvements made at a higher level on those made at a lower level.
For instance, if a recommendation to replace a given policy with a better one is made with proper justification and accepted in principle by business process owners, then corresponding changes in the consequent processes and procedures will follow naturally in order to enable implementation of the policies" [Business process. Wikipedia]
The business process modeling diagram example "Taxi service order procedure - BPMN 1.2 diagram" was created using the ConceptDraw PRO diagramming and vector drawing software extended with the Business Process Diagram solution from the Business Processes area of ConceptDraw Solution Park.
Business process modeling
Six Markets Model Chart

The vector stencils library "Marketing diagrams" contains 12 templates of marketing and sales diagrams and charts. Use it to illustrate your marketing and sales documents, presentations, infographics and webpages in ConceptDraw PRO software extended with Marketing Diagrams solution from Marketing area of ConceptDraw Solution Park.
Diffusion of Innovations

Normal distribution

Five forces model

Leaky bucket diagram

Funnel diagram

Relationship ladder of customer loyalty

Six markets model

Product life cycle graph

Extended product life cycle graph

Service-goods continuum diagram

Step chart block

Step diagram block

Cloud Computing Architecture

Marketing Sales Funnel Examples

Online Marketing Objectives

 Cloud Computing Diagrams
The Cloud Computing Diagrams solution extends the functionality of the ConceptDraw DIAGRAM diagramming software with a comprehensive collection of libraries of commonly accepted cloud computing vector stencils to help you to get started designing Cloud Computing Diagrams, Architecture Diagrams and Cloud Computing Architecture Diagrams without effort. This solution lets one professionally depict the way how the cloud computing works, allows giving a powerful introduction to the Cloud computing architecture and Amazon cloud computing architecture, to display the essence of the cloud computing, the main characteristics and classification of the cloud services thanks to the wide variety of predesigned samples and examples.
- Service -goods continuum diagram | Marketing Diagrams | Marketing ...
- Service -goods continuum diagram | Marketing Diagrams | Process ...
- Service -goods continuum diagram | Pyramid Chart Examples ...
- Fishbone Diagram | Fishbone Diagrams | Service 8 Ps fishbone ...
- The Fish Bone Diagram In Service Marketing
- Service -goods continuum diagram | Marketing Diagrams | Leaky ...
- Flowchart Marketing Process. Flowchart Examples | Marketing and ...
- Services Marketing In Diagram
- Fishbone Diagram In Marketing Of Services
- Pyramid Chart Examples | Service -goods continuum diagram ...
- Leaky bucket diagram | Marketing Diagrams | Bucket Theory In ...
- Fishbone Diagrams | How Do Fishbone Diagrams Solve ...
- Leaky bucket diagram | Marketing Diagrams | Marketing diagrams ...
- Marketing Diagrams | Marketing Analysis Diagram | Flowchart ...
- Block diagram - Marketing targeting | AD LDS as a phone book ...
- Graph Or Diagram Product Mix In Service Marketing
- Service -goods continuum diagram | Process Flowchart | Marketing ...
- Service Marketing Pyramid
- Gantt chart examples | Online Marketing Objectives | Gant Chart in ...