Structured Systems Analysis and Design Method (SSADM) with ConceptDraw PRO
Structured Systems Analysis and Design Method SSADM is the method which is used at projecting and analysis of information systems. SSADM is based on the data flow diagrams. At the description of data flows out of the system and into the system DFD, which denote boundaries of the system, are used.Basic Flowchart Symbols and Meaning
Flowchart Symbols and Meaning - Provides a visual representation of basic flowchart symbols and their proposed use in professional workflow diagram, standard process flow diagram and communicating the structure of a well-developed web site, as well as their correlation in developing on-line instructional projects. See flowchart's symbols by specifics of process flow diagram symbols and workflow diagram symbols.Pyramid Diagram
The Project Management Triangle Diagram depicts three main constraints of any project: scope, time and cost. Projects have to comply with the specified scope, projects should be finished in time and projects need to consume the budget. Each of the constraints represents one side of the triangle, and any change in budget or timing or scope affects the entire diagram.Total Quality Management Value
The Total Quality Management Diagram solution helps you and your organization visualize business and industrial processes. Create Total Quality Management diagrams for business process with ConceptDraw software.Process Flowchart
ConceptDraw is Professional business process mapping software for making process flow diagram, workflow diagram, general flowcharts and technical illustrations for business documents. It is includes rich examples, templates, process flowchart symbols. ConceptDraw flowchart maker allows you to easier create a process flowchart. Use a variety of drawing tools, smart connectors, flowchart symbols and shape libraries to create flowcharts of complex processes, process flow diagrams, procedures and information exchange.Definition TQM Diagram
The Total Quality Management Diagram solution helps your organization visualize business and industrial processes. Create Total Quality Management diagrams for business process with ConceptDraw software.Gantt charts for planning and scheduling projects
Using Gantt chart software is perfect for planning, scheduling and monitoring project development or resource allocation. ConceptDraw is simple project scheduling software for reporting project statuses and maintaining gantt charts of milestones and tasks.How to Create Gantt Chart
To begin managing a new project, you will need to define the individual Tasks that must be completed to deliver it. The default view for a new project in ConceptDraw PROJECT is the Gantt Chart.Gant Chart in Project Management
Gant Chart is a graphical representation of tasks as segments on a time scale. It helps plan and monitor project development or resource allocation. The horizontal axis is a time scale, expressed either in absolute or relative time.CORRECTIVE ACTIONS PLANNING. Involvement Matrix
The Involvement Matrix can identify the distribution of responsibilities and identify roles in a group or team. Use the Involvement Matrix to specify roles and responsibilities of actions in problem solving.ConceptDraw Office suite is a software for corrective actions planning.
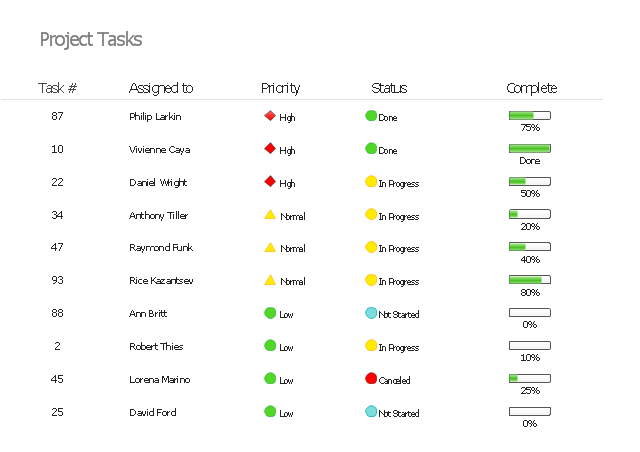
"In project management, a task is an activity that needs to be accomplished within a defined period of time or by a deadline. A task can be broken down into assignments which should also have a defined start and end date or a deadline for completion. One or more assignments on a task puts the task under execution. Completion of all assignments on a specific task normally renders the task completed. Tasks can be linked together to create dependencies." [Task (project management). Wikipedia]
The example "Project task status dashboard" was created using the ConceptDraw PRO diagramming and vector drawing software extended with the Status Dashboard solution from the area "What is a Dashboard" of ConceptDraw Solution Park.
PM Meetings
PM Meetings solution extends ConceptDraw MINDMAP software with special tools, features, and templates, making the preparation for meetings of different orientation a quick and simple task, and allowing the project managers, team leaders, management specialists, and meeting organizers the capability to prepare easily and quickly for regular project meetings using solution's templates, to brainstorm ideas, to record brainstorming results, to keep the meetings on track, and to share meeting results immediately and without efforts. The meetings become more efficient because of the ability to easily record results, the collaborative team decisions are captured as a part of the meeting process, the meeting notes are easily distributed at a meeting’s conclusion to all participants and stakeholders.
Tool for Workgroup Briefings, Meetings and Decisions
A key point of conference success is the ability to see slides in real time, and hold documented discussions during the meeting. Remote Presentation for Skype is a new solution allows real-time presenting that benefits work groups who need collaborate by web meetings.Product Overview
ConceptDraw PROJECT is a vigorous tool for managing single or multiple projects. It lets you determine all essential elements involved into project, control schedules, resources and finances, and monitor projects' progress in most effective yet simple manner.- Flowchart Definition | Gant Chart in Project Management | Flowchart ...
- Project management life cycle - Flowchart | Audit flowchart - Project ...
- Gant Chart in Project Management | How to Create Gantt Chart ...
- Project Management Charter
- Stakeholder Onion Diagrams | Project Management Area | Network ...
- Project management process | Flowchart
- Gantt chart examples | Gantt Chart Software | Gant Chart in Project ...
- Critical Path Method in ConceptDraw PROJECT | How to Discover ...
- Flowchart Definition | Basic Flowchart Symbols and Meaning | Cross ...
- How to Draw a Gantt Chart Using ConceptDraw PRO | Gant Chart in ...
- Total Quality Management Definition
- Pyramid Diagram | Total Quality Management Definition | TQM ...
- Gant Chart in Project Management | Gantt Chart Software | Gantt ...
- Gant Chart in Project Management | Gantt chart examples | Process ...
- Audit Flowcharts | Audit Flowchart Symbols | Basic Audit Flowchart ...
- PM Dashboards | Status Dashboard | Project management task ...
- Diagram Related To Definition Of Marketing
- Project planning process - Flowchart | Audit flowchart - Project ...
- Fish Bone Project Management
- Gant Chart in Project Management | Gantt charts for planning and ...
- ERD | Entity Relationship Diagrams, ERD Software for Mac and Win
- Flowchart | Basic Flowchart Symbols and Meaning
- Flowchart | Flowchart Design - Symbols, Shapes, Stencils and Icons
- Flowchart | Flow Chart Symbols
- Electrical | Electrical Drawing - Wiring and Circuits Schematics
- Flowchart | Common Flowchart Symbols