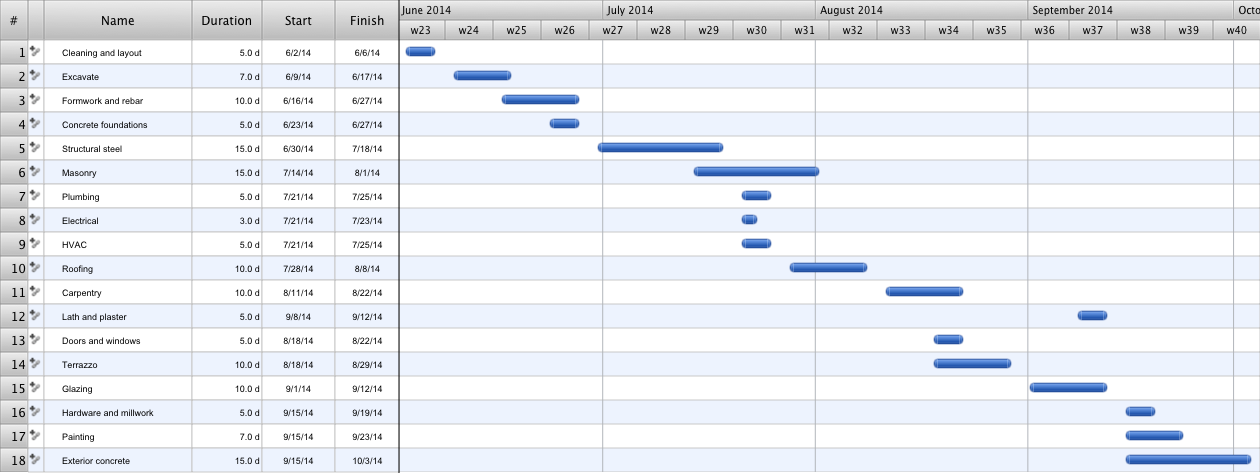
Gant Chart in Project Management


How to Create Gantt Chart

Gantt chart examples

HelpDesk
How to Create a Gantt Chart for Your Project

Gantt charts for planning and scheduling projects

Product Overview

 PM Easy
PM Easy solution extends the ConceptDraw PROJECT functionality with an ability to support neutral methodology of project management and to quickly start a project by listing the task relationships and dependencies, that makes the iterative planning much easier. The project management tool and available visual tools, such as mind mapping, increase the effectiveness of tracking and analysis your project tasks. PM Easy solution from ConceptDraw Solution Park is mainly targeted at project managers in small or medium-sized companies, allowing them to make the project plan and execute projects using mind mapping technique, to implement planning using mind mapping, and to track tasks using ConceptDraw PROJECT application.
Construction Project Chart Examples
"Project planning is part of project management, which relates to the use of schedules such as Gantt charts to plan and subsequently report progress within the project environment.
Initially, the project scope is defined and the appropriate methods for completing the project are determined. Following this step, the durations for the various tasks necessary to complete the work are listed and grouped into a work breakdown structure. Project planning is often used to organize different areas of a project, including project plans, work loads and the management of teams and individuals. The logical dependencies between tasks are defined using an activity network diagram that enables identification of the critical path. Float or slack time in the schedule can be calculated using project management software. Then the necessary resources can be estimated and costs for each activity can be allocated to each resource, giving the total project cost. At this stage, the project schedule may be optimized to achieve the appropriate balance between resource usage and project duration to comply with the project objectives. Once established and agreed, the project schedule becomes what is known as the baseline schedule. Progress will be measured against the baseline schedule throughout the life of the project. Analyzing progress compared to the baseline schedule is known as earned value management.
The inputs of the project planning phase include the project charter and the concept proposal. The outputs of the project planning phase include the project requirements, the project schedule, and the project management plan." [Project planning. Wikipedia]
The flow chart example "Project planning process" was created using the ConceptDraw PRO diagramming and vector drawing software extended with the Flowcharts solution from the area "What is a Diagram" of ConceptDraw Solution Park.
Flowchart - Project planning process

HelpDesk
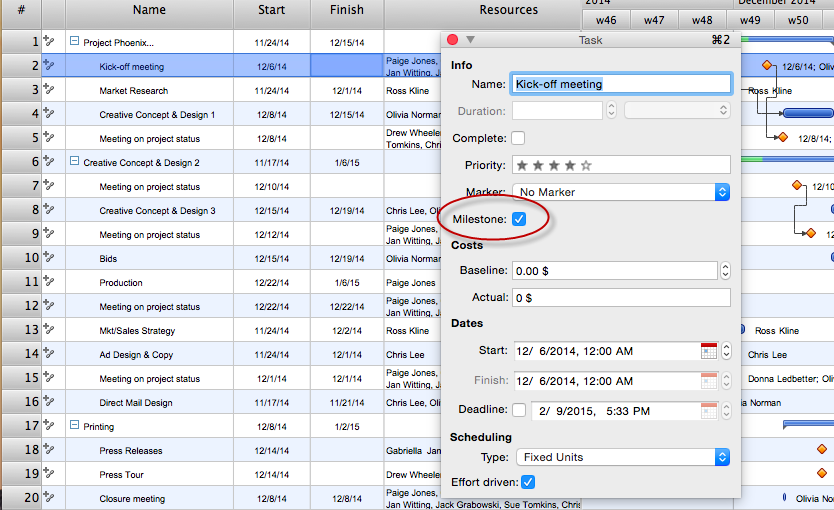
How to Identify Project Milestones
HelpDesk
How to Import Project Data From MS Excel File

Business diagrams & Org Charts with ConceptDraw DIAGRAM


Activity Network Diagram Method

Create Response Charts

ConceptDraw DIAGRAM Compatibility with MS Visio

- Gant Chart in Project Management | What is Gantt Chart (historical ...
- Gant Chart in Project Management | How to Draw a Gantt Chart ...
- PM Easy | How to Report Task's Execution with Gantt Chart | Product ...
- Activity Network Diagram Method | | Flowchart - Project planning ...
- Activity Network Diagram Method | How to Draw a Gantt Chart Using ...
- How to Report Task's Execution with Gantt Chart ... - Conceptdraw.com
- How to Create Gantt Chart | PERT Chart Software | Gantt Chart ...
- Gant Chart in Project Management | Gantt charts for planning and ...
- Flowchart Definition | Flowchart | Process Flow Chart | Explain The ...
- Gantt chart examples | Gant Chart in Project Management | Gantt ...
- How to Create Gantt Chart | Gantt chart examples | Gantt charts for ...
- How to Discover Critical Path on a Gantt Chart | Critical Path Method ...
- PM Easy | How to Report Task's Execution with Gantt Chart ...
- Gantt chart examples | Gantt charts for planning and scheduling ...
- How to Make a Mind Map from a Project Gantt Chart | Business ...
- Flowchart of Products. Flowchart Examples | Gantt chart examples ...
- Project — Working With Costs | Gantt Chart Software | Business ...
- How to Discover Critical Path on a Gantt Chart | Gantt Chart ...
- Gant Chart in Project Management | Gantt chart examples | How to ...
- How to Report Task's Execution with Gantt Chart | How to Create ...