How to Create Gantt Chart

Gantt chart examples

Gantt charts for planning and scheduling projects

 PM Planning
This solution extends ConceptDraw MINDMAP and ConceptDraw Project software, allowing you to automatically create documents that reflect a project's status, for people who have different project roles.
Collaboration in a Project Team

Gant Chart in Project Management


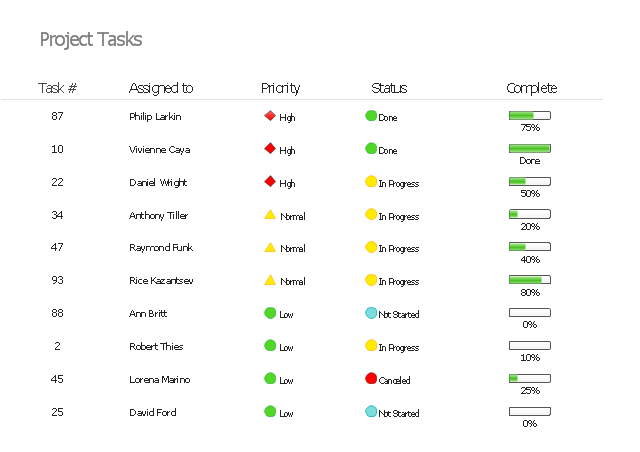
"In project management, a task is an activity that needs to be accomplished within a defined period of time or by a deadline. A task can be broken down into assignments which should also have a defined start and end date or a deadline for completion. One or more assignments on a task puts the task under execution. Completion of all assignments on a specific task normally renders the task completed. Tasks can be linked together to create dependencies." [Task (project management). Wikipedia]
The example "Project task status dashboard" was created using the ConceptDraw PRO diagramming and vector drawing software extended with the Status Dashboard solution from the area "What is a Dashboard" of ConceptDraw Solution Park.
The example "Project task status dashboard" was created using the ConceptDraw PRO diagramming and vector drawing software extended with the Status Dashboard solution from the area "What is a Dashboard" of ConceptDraw Solution Park.
Status dashboard
Introductory Guide to Rapid UML Solution

Software development with ConceptDraw Products

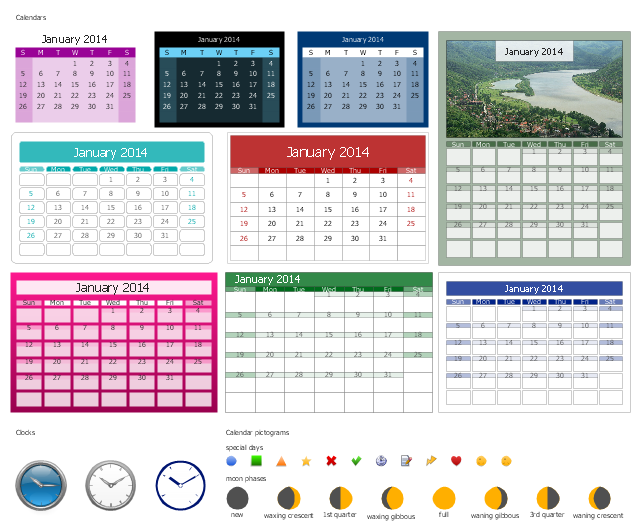
The vector stencils library "Calendars" contains 44 month calendars templates, marker icons and symbols for schedules, and clock clipart. Use it for creating the business calendars and time management infographics using the ConceptDraw PRO diagramming and vector drawing software.
"Time management is the act or process of planning and exercising conscious control over the amount of time spent on specific activities, especially to increase effectiveness, efficiency or productivity.
It is a meta - activity with the goal to maximize the overall benefit of a set of other activities within the boundary condition of a limited amount of time.
Time management may be aided by a range of skills, tools, and techniques used to manage time when accomplishing specific tasks, projects, and goals complying with a due date. Initially, time management referred to just business or work activities, but eventually the term broadened to include personal activities as well. A time management system is a designed combination of processes, tools, techniques, and methods. Time management is usually a necessity in any project development as it determines the project completion time and scope." [Time management. Wikipedia]
The example "Design elements - Calendars" is included in the Calendars solution from the Management area of ConceptDraw Solution Park.
Calendars and clocks
 PM Easy
This solution extends ConceptDraw PROJECT software with the ability to quickly start a project; it lists task relationships and dependencies to make iterative planning easy.
"Time management is the .. process of planning and exercising conscious control over the amount of time spent on specific activities, especially to increase effectiveness, efficiency or productivity. Time management may be aided by a range of skills, tools, and techniques used to manage time when accomplishing specific tasks, projects, and goals complying with a due date. Initially, time management referred to just business or work activities, but eventually the term broadened to include personal activities as well. A time management system is a designed combination of processes, tools, techniques, and methods. Time management is usually a necessity in any project development as it determines the project completion time and scope." [Time management. Wikipedia]
This timetable pie chart shows the plan of daily actions and its durations in minutes.
It is useful visual tool of personal time management.
This schedule pie chart example was created using the ConceptDraw PRO diagramming and vector drawing software extended with the Target and Circular Diagrams solution from the Marketing area of ConceptDraw Solution Park.
www.conceptdraw.com/ solution-park/ marketing-target-and-circular-diagrams
Daily activities pie chart

How to create your UML Diagram

How to Report Task's Execution with Gantt Chart

Timeline charts presents events and time periods on a chronological scale. They are used in project management to visualize project milestones and upper level phases, and show project progress.
"Within the framework of project management, a milestone is an event that receives special attention. It is often put at the end of a stage to mark the completion of a work package or phase. Milestones can be put before the end of a phase so that corrective actions can be taken, if problems arise, and the deliverable can be completed on time.
In addition to signaling the completion of a key deliverable, a milestone may also signify an important decision or the derivation of a critical piece of information, which outlines or affects the future of a project. In this sense, a milestone not only signifies distance traveled (key stages in a project) but also indicates direction of travel since key decisions made at milestones may alter the route through the project plan." [Milestone (project management). Wikipedia]
This timeline diagram example was created using the ConceptDraw PRO diagramming and vector drawing software extended with the Timeline Diagrams solution from the Management area of ConceptDraw Solution Park.
Timeline

Gantt Chart Software

- CORRECTIVE ACTIONS PLANNING PERT Chart | Winter Sports ...
- Design elements - Calendars | Business diagrams & Org Charts with ...
- Seven Management and Planning Tools | Design elements ...
- Microreports, calendars, project management ... - Conceptdraw.com
- Seven Management and Planning Tools | Total Quality Management ...
- Seven Management and Planning Tools | Fishbone Diagram ...
- Calendar template | Design elements - Calendars | PM Teams |
- Social Media Response Management Charts - software tools ...
- Examples of Flowcharts, Org Charts and More | Business calendar ...
- Illustration | Universal Diagramming Area | Schedule pie chart ...
- Total Quality Management TQM Diagrams
- How To Hold Project Collaboration via Skype | One formula of ...
- Status Dashboard | PM Dashboards | Project management task ...
- Project timeline diagram - New business project plan | Project plan ...
- Management - Design Elements | Design elements - Management ...
- Timeline Diagrams | Timeline template | Timeline diagram |
- Pie Chart Software | Pie Chart Examples and Templates | Pie Donut ...
- Pie chart template
- Vector clipart - Professions | Project management - Design Elements ...
- PM Dashboards | How To Create Project Report | What is a ...