HelpDesk
How to Create Project Dashboard on Mac

HelpDesk
How to Use ConceptDraw Dashboard for Facebook on OS X

KPI Dashboard

Sales Dashboard - Access Anywhere
HelpDesk
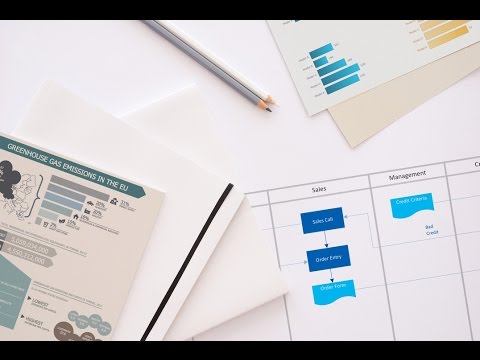
How to Manage Multiple Projects on Mac

Dashboard Software
 Sales Dashboard
Sales Dashboard solution extends ConceptDraw PRO software with templates, samples and library of vector stencils for drawing the visual dashboards of sale metrics and key performance indicators (KPI).
Reporting Dashboard Software for Business
 Mac OS X User Interface
Mac OS User Interface solution extends ConceptDraw PRO gui software with templates, samples and Mac OS user interface design examples, and large quantity of libraries with variety of vector stencils for designing the OS X 10.10 Yosemite user interfaces.
 ConceptDraw Dashboard for Facebook
ConceptDraw Dashboard for Facebook solution extends ConceptDraw PRO software with a dynamically updated visual dashboard, which shows lifetime total likes, daily friends of fans, and daily page views, information you can receive from Facebook Insights.
 Meter Dashboard
Meter dashboard solution extends ConceptDraw PRO software with templates, samples and vector stencils library with meter indicators for drawing visual dashboards showing quantitative data.
Sales Dashboard

ConceptDraw PRO software extended with Sales Dashboard solution from the Marketing area of ConceptDraw Solution Park is effective for visualizing sales data, all set of KPIs on the Sales Dashboard with purpose to see how your business develops and to make conclusions for improvement the sales.
 Frequency Distribution Dashboard
Frequency distribution dashboard solution extends ConceptDraw PRO software with samples, templates and vector stencils libraries with histograms and area charts for drawing the visual dashboards showing frequency distribution of data.
 Comparison Dashboard
Comparison dashboard solution extends ConceptDraw PRO software with samples, templates and vector stencils library with charts and indicators for drawing the visual dashboard comparing data.
- How to Create Project Dashboard on Mac | Pie Charts | How to ...
- PM Dashboards | Status Dashboard | How to Create Project ...
- PM Dashboards | KPI Dashboard | How to Create Project ...
- Projects HR dashboard | Simple Drawing Applications for Mac ...
- PM Dashboards | How to Create Project Dashboard on Mac | Status ...
- Status Dashboard | PM Dashboards | How to Create Project ...
- Status Dashboard | PM Dashboards | Project tasks dashboard ...
- Reporting Dashboard Software for Business | Dashboard Software ...
- PM Dashboards | PM Presentations | How to Create Project ...
- Dashboard Software | Reporting Dashboard Software for Business ...
- Sales Dashboard - Access Anywhere | Sales Dashboard ...
- Sales Dashboard | Sales Territory Presentation Powerpoint Mac Free
- Mac Dashboard
- Sales Dashboard Template | Sales Dashboard - Access Anywhere ...
- How to Use ConceptDraw Sales Dashboard Solution | How to ...
- Ms Project Dashboard Report
- Project Dashboard Examples Free
- Sales Dashboard | Meter Dashboard | Status Dashboard | Dashboard
- Sales Dashboard - Access Anywhere | Sales Dashboard Template ...