Pyramid Chart Examples

"Brand awareness refers to customers' ability to recall and recognize the brand under different conditions and link to the brand name, logo, jingles and so on to certain associations in memory. It consists of both brand recognition and brand recall. It helps the customers to understand to which product or service category the particular brand belongs and what products and services are sold under the brand name. It also ensures that customers know which of their needs are satisfied by the brand through its products (Keller). Brand awareness is of critical importance since customers will not consider your brand if they are not aware of it. There are various levels of brand awareness that require different levels and combinations of brand recognition and recall. Top-of-Mind is the goal of most companies. Top-of-mind awareness occurs when your brand is what pops into a consumers mind when asked to name brands in a product category." [Brand. Brand awareness. Wikipedia]
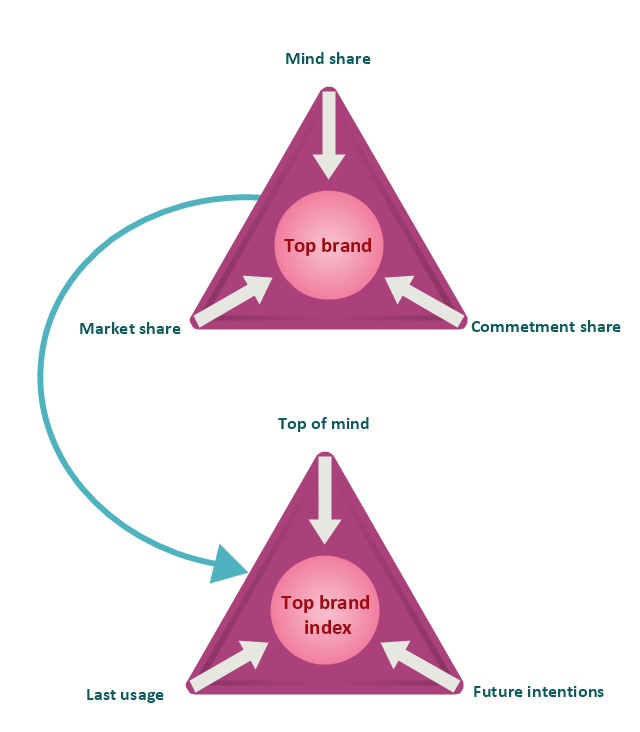
This top brand model pyramid diagram was redesigned using the ConceptDraw PRO diagramming and vector drawing software from Wikimedia Commons file Diagram Top Brand Model.jpg. [commons.wikimedia.org/ wiki/ File:Diagram_ Top_ Brand_ Model.jpg]
This file is licensed under the Creative Commons Attribution-Share Alike 3.0 Unported license. [creativecommons.org/ licenses/ by-sa/ 3.0/ deed.en]
The example "Top brand model pyramid diagram" is included in the Pyramid Diagrams solution from the Marketing area of ConceptDraw Solution Park.
Triangular charts
Competitor Analysis

 Pyramid Diagrams
Pyramid Diagrams solution extends ConceptDraw DIAGRAM software with templates, samples and library of vector stencils for drawing the marketing pyramid diagrams.
Pyramid Diagram and Pyramid Chart

Pyramid Diagram

Pyramid Diagram

Fundraising Pyramid

Bar Diagrams for Problem Solving. Create event management bar charts with Bar Graphs Solution

Pyramid Diagram

How to Create a Column Chart

Pyramid Diagram

Pyramid Diagram

Pyramid Diagram

How to Create a Line Chart

- Pyramid Chart Examples | Top brand model - Pyramid diagram ...
- Pyramid Chart Examples | Top brand model - Pyramid diagram ...
- Pyramid Chart Examples | Pyramid Diagram and Pyramid Chart ...
- Brand essence model - Wheel diagram | Top brand model - Pyramid ...
- Pyramid Chart Examples | Top brand model - Pyramid diagram ...
- Pyramid Chart Examples | Top brand model - Pyramid diagram ...
- Brand essence model - Wheel diagram | Competitor Analysis ...
- Pyramid Chart Examples | Active Directory Diagram | Brand ...
- Pyramid Chart Examples | Top brand model - Pyramid diagram ...
- Pyramid Chart Examples | Block diagram - Branding strategies ...
- Brand Positioning Pyramid Examples
- Brand Pyramid Template
- Brand Hierarchy Pyramid
- Competitor Analysis | Brand essence model - Wheel diagram ...
- Pyramid Chart Examples | How to Make SWOT Analysis in a Word ...
- Social Brand Strategy | Competitor Analysis | Pyramid Chart ...
- Pyramid Chart Examples | Pyramid Diagram | Sales Process ...
- Block diagram - Branding strategies | Competitor Analysis | Pyramid ...
- Pyramid Chart Examples | Brand essence model - Wheel diagram ...