Stakeholder Onion Diagram Template

Cisco Network Topology. Cisco icons, shapes, stencils and symbols

Pyramid Diagram

 Computer Network Diagrams
Computer Network Diagrams solution extends ConceptDraw DIAGRAM software with samples, templates and libraries of vector icons and objects of computer network devices and network components to help you create professional-looking Computer Network Diagrams, to plan simple home networks and complex computer network configurations for large buildings, to represent their schemes in a comprehensible graphical view, to document computer networks configurations, to depict the interactions between network's components, the used protocols and topologies, to represent physical and logical network structures, to compare visually different topologies and to depict their combinations, to represent in details the network structure with help of schemes, to study and analyze the network configurations, to communicate effectively to engineers, stakeholders and end-users, to track network working and troubleshoot, if necessary.
ERD Symbols and Meanings


Workflow Diagram Template

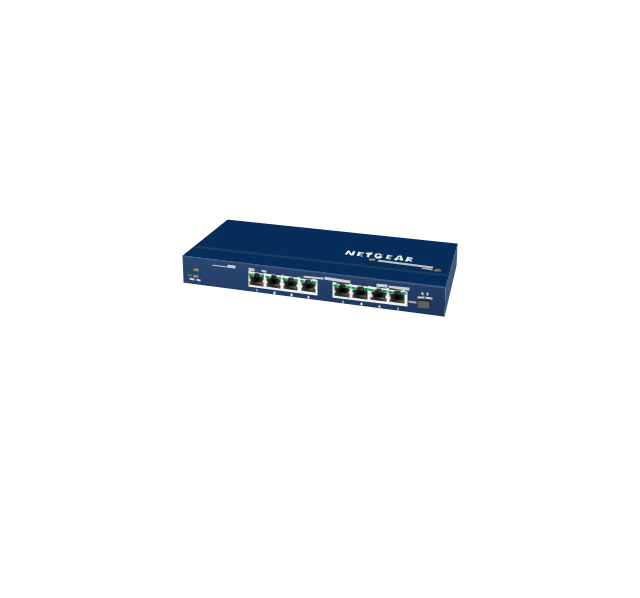
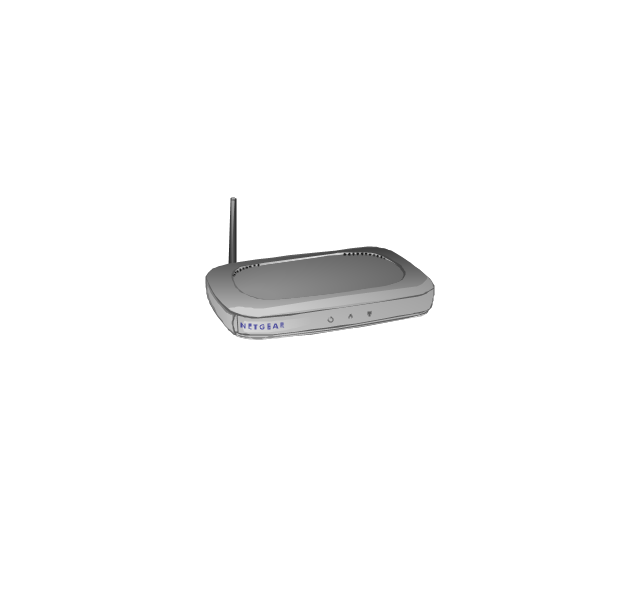
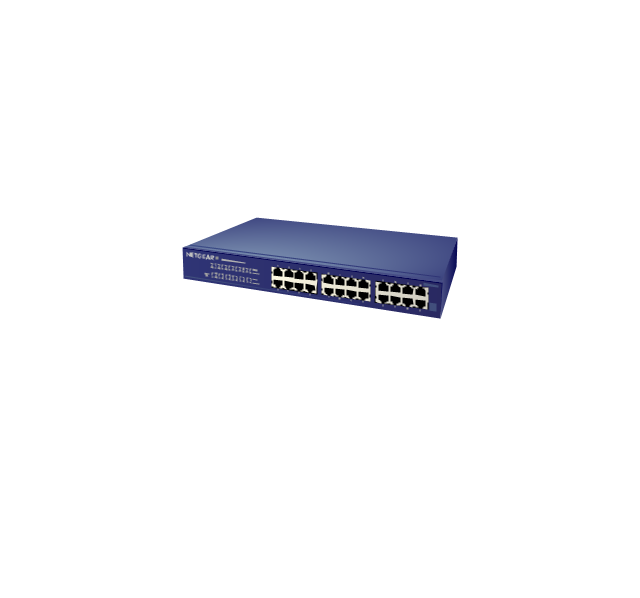
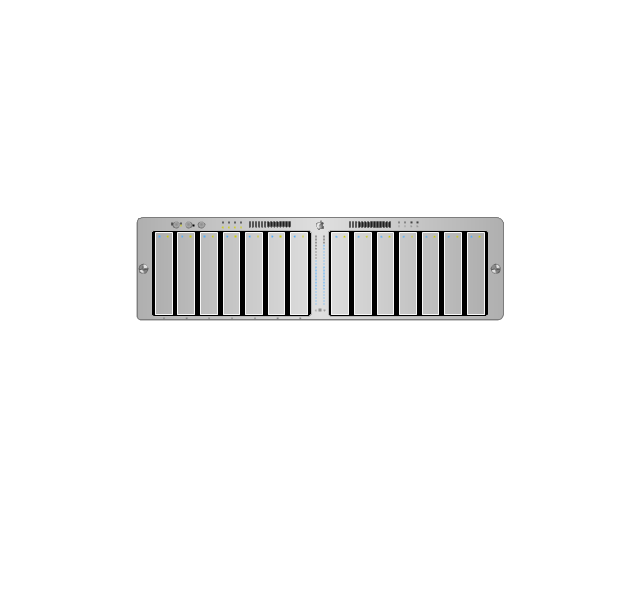
The vector stencils library "Computer network" contains 51 symbols of computer network devices and equipment for drawing computer network diagrams.
"Network Mapping Software.
A number of software tools exist to design computer network diagrams / or generate visual maps of networks, servers, storage, services, data centers, and other peripherals. Broadly, there are two types of software tools - those that help create diagrams manually and those that generate them using automated / semi-automated approaches.
Type of Software.
(1) Manual - allows users to design and draw logical and physical topology diagrams by manually placing icons and connections.
(2) Automated - generate topology diagrams / maps by traversing the network and automatically discovering resident devices or by importing network data." [Comparison of network diagram software. Wikipedia]
ConceptDraw PRO is the software for manual design of computer network diagrams. The solutions of the Computer and Networks area in ConceptDraw Solution Park extend ConceptDraw PRO with vector stencils libraries, templates and examples for creating the computer network diagrams.
The symbols example "Computer network - Vector stencils library" was created using the ConceptDraw PRO diagramming and vector drawing software extended with the Computer and Networks solution from the Computer and Networks area of ConceptDraw Solution Park.
www.conceptdraw.com/ solution-park/ computer-and-networks
Laptop

Desktop computer

Firewall
Bus

Ethernet
Star network

FDDI Ring

Token-ring

Comm-link

Modem

Laser printer
Inkjet printer
Image scanner

City

Ethernet hub
Wireless router
Network switch
iPod Classic

iPhone/ iPod Touch

Xserve RAID
XServe

Apple Thunderbolt Display

Data store

Mac Pro

iMac
RAID

Mainframe

Rack-mountable server

Server

PDA

Cloud

Computer monitor
Workstation

Router
IP Phone
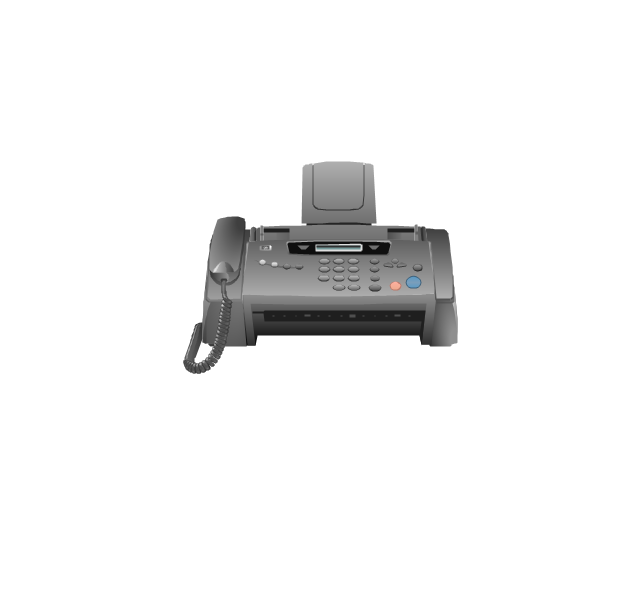
Fax
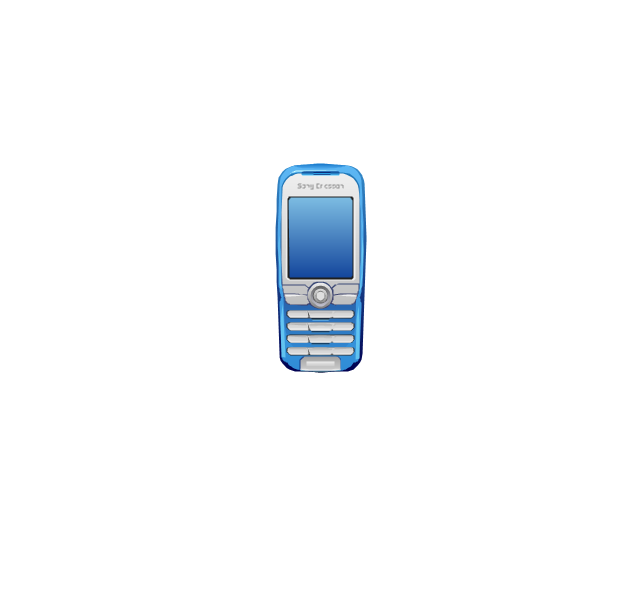
Mobile phone
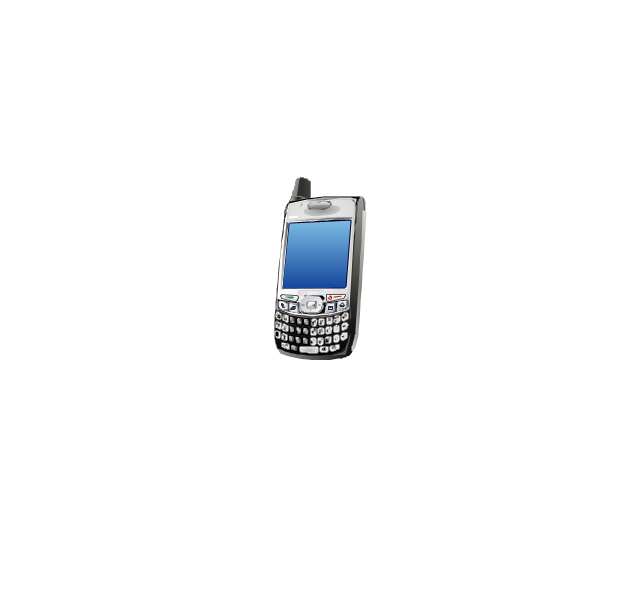
Smartphone
Compact Disk

Mouse

Apple Wireless Mouse

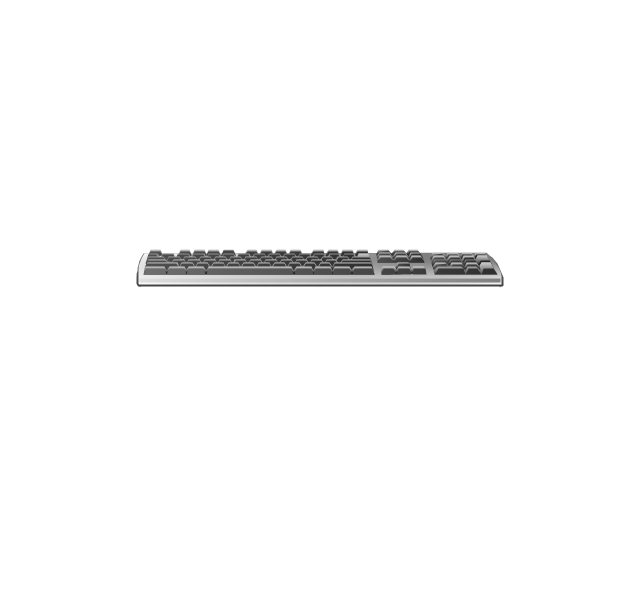
Computer keyboard
Apple Keyboard
Radio tower

Satellite dish
Satellite
Webcam
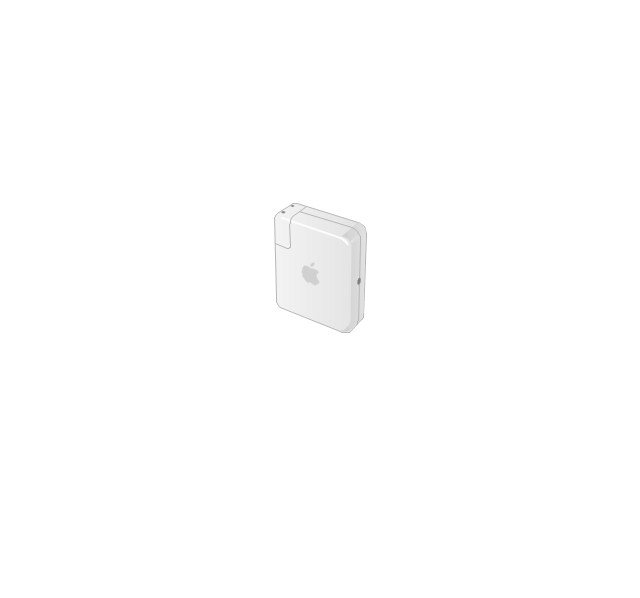
AirPort Extreme

Airport Express
MacBook

iPhone 4

SWOT Analysis

 Network Layout Floor Plans
Network Layout Floor Plans solution extends ConceptDraw DIAGRAM software functionality with powerful tools for quick and efficient documentation the network equipment and displaying its location on the professionally designed Network Layout Floor Plans. Never before creation of Network Layout Floor Plans, Network Communication Plans, Network Topologies Plans and Network Topology Maps was not so easy, convenient and fast as with predesigned templates, samples, examples and comprehensive set of vector design elements included to the Network Layout Floor Plans solution. All listed types of plans will be a good support for the future correct cabling and installation of network equipment.
Bubble diagrams in Landscape Design with ConceptDraw DIAGRAM

Network Components

Venn Diagram Examples for Problem Solving. Computer Science. Chomsky Hierarchy

Azure Storage

Architecture Diagrams

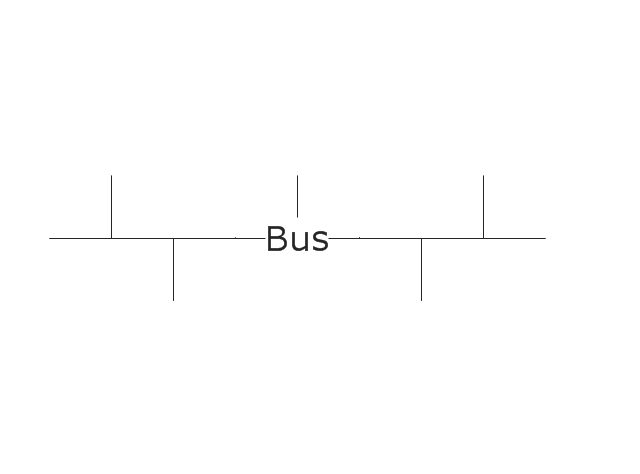
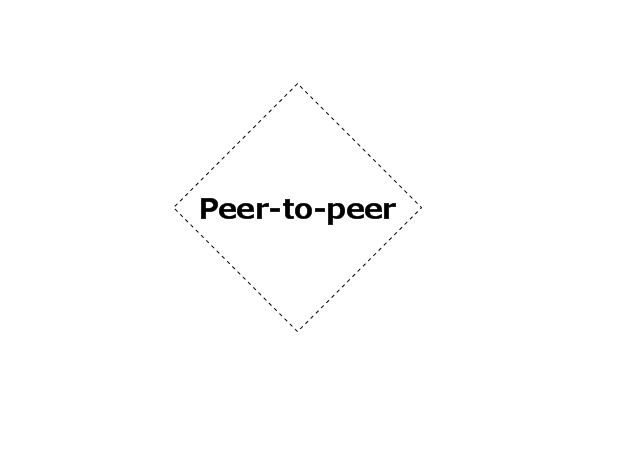
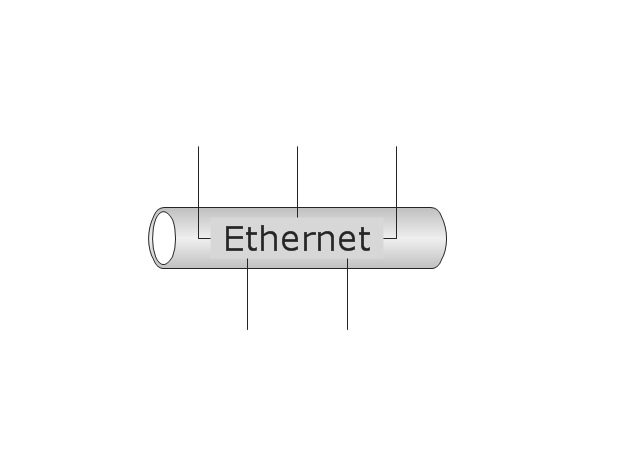
The vector stencils library "Logical symbols" contains 49 logical symbols for drawing logical network topology diagrams.
"Logical topology, or signal topology, is the arrangement of devices on a computer network and how they communicate with one another. How devices are connected to the network through the actual cables that transmit data, or the physical structure of the network, is called the physical topology. Physical topology defines how the systems are physically connected. It represents the physical layout of the devices on the network. The logical topology defines how the systems communicate across the physical topologies.
Logical topologies are bound to network protocols and describe how data is moved across the network. ... EXAMPLE : twisted pair Ethernet is a logical bus topology in a physical star topology layout. While IBM's token ring is a logical ring topology, it is physically set up in star topology." [Logical topology. Wikipedia]
The icons example "Logical symbols - Vector stencils library" was created using the ConceptDraw PRO diagramming and vector drawing software extended with the Computer and Networks solution from the Computer and Networks area of ConceptDraw Solution Park.
www.conceptdraw.com/ solution-park/ computer-and-networks
Coaxial Line Tag

Fiber Optic Line Tag

Twisted Pair Line Tag

SC2200 Signaling Controller

Bridge

Network Management Appliance

Access Server (Communications Server)
-logical-symbols---vector-stencils-library.png--diagram-flowchart-example.png)
Terminal Server

Web Browser

Security Management, Cisco
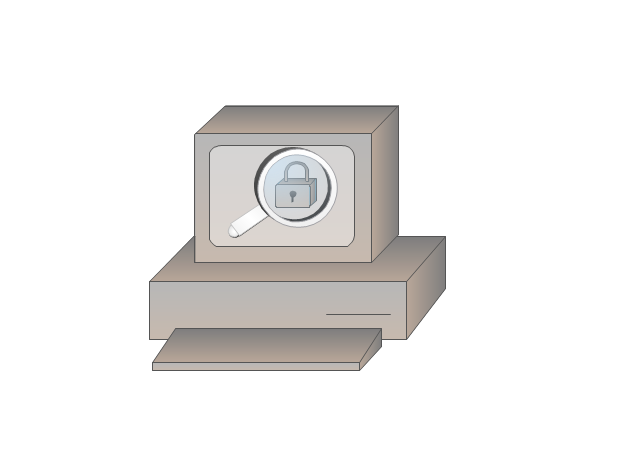
Lock and Key

Lock

Key

Relational Database
Host
CSU/DSU
WAN
University
Government building

Home Office
Telecommuter House PC
Medium Building, Regular
Headquarters, Subdued
House, Regular

Small Business
Network Connector

Dynamic Connector

Line Connector

Line-curve Connector

Bus
FDDI Ring

Peer-to-peer
Token-ring

Star

Comm-link

Curved Bus
Ethernet
Cloud

Speaker
Microphone

Router
ATM Router

ISDN Switch

ATM Switch

ATM/FastGB Etherswitch

Workgroup Switch
Small Hub

100BaseT Hub

CDDI-FDDI

 Target and Circular Diagrams
This solution extends ConceptDraw DIAGRAM software with samples, templates and library of design elements for drawing the Target and Circular Diagrams.
Simple Flow Chart

Business Diagram Software


Sections of the Value Stream Map

Ice Hockey Diagram — Entering Offensive Zone Drill

- 10Base-T star topology - Network diagram | Logical network ...
- Star Network Topology | Hybrid Network Topology | 10Base-T star ...
- Point to Point Network Topology | Wireless access point | Star ...
- Star Network Topology | Show Me The Diagram Of The Apparatus
- Local area network (LAN). Computer and Network Examples ...
- Rack Diagrams | How To use Switches in Network Diagram ...
- Geometry Diagrams
- Logical network topology diagram | Network Protocols | Logical ...
- Circle-Spoke Diagrams
- Venn Diagram Examples for Problem Solving. Environmental Social ...
- How To use Switches in Network Diagram | Cisco routers - Vector ...
- Personal area (PAN) networks. Computer and Network Examples ...
- ATM Network. Computer and Network Examples | Network ...
- Proton-proton chain reaction diagram | Physics Symbols | Physics ...
- Communication network diagram | Wireless router network diagram ...
- How To Make Chen ER Diagram | Entity Relationship Diagram ...
- Social determinants of health | Circle-spoke diagram - Vector ...
- Solar System Symbols | Design elements - Stars and planets | Sun ...
- Plane geometry - Vector stencils library | The Diagram Of Plane ...
- Network Hubs | Computer network - Vector stencils library | Cisco ...