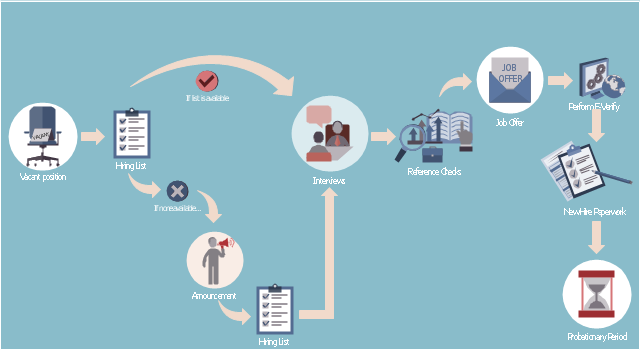
This HR infographics example was designed on the base of flowchart "Hiring Process" from the website of the Idaho Division of Human Resources.
"... hiring process flowchart outlining the steps to fill a vacant position." [dhr.idaho.gov/ hiringprocess.html]
"What is a hiring list and what are they for?
A hiring list consists of applicants who completed and passed the examination for a vacant classified position.
The applicants are ranked on the hiring list in order from highest to lowest score." [dhr.idaho.gov/ PDF%20 documents/ Flowchart/ Hiring%20 List%20 Guidance.pdf]
"Announcements.
Announcing a vacant position benefits the agency by allowing a wide array of applicants the opportunity to compete for job openings, resulting in a more qualified employee. The State Merit System requires all appointments, promotions and separations in the classified service to be based on competence, valid job requirements, and individual performance." [dhr.idaho.gov/ PDF%20 documents/ Flowchart/ Announcement.pdf]
"Conducting A Lawful Employment Interview.
Interviewing prospective employees is one of the most important activities employers do. The employer’s objective of an interview is to determine whether an applicant is suitable for an available position. The interview provides the employer an opportunity to obtain in-depth information about a job applicant’s skills, work history, and employment background for this purpose." [dhr.idaho.gov/ PDF%20 documents/ Flowchart/ Conducting%20 a%20 Lawful%20 Employment%20 Interview.pdf]
"Reference Checks.
References should be checked after a successful interview with a candidate, but before you offer them the position. If after interviewing there are several candidates that are qualified for the position, reference checks are also a way to further distinguish who might best fit within your agency." [dhr.idaho.gov/ PDF%20 documents/ Flowchart/ Reference%20 Checks.pdf]
"Making the job offer.
Before offering the position to your selected candidate, be sure to speak with your HR and fiscal staff. They may have some suggestions for negotiating the starting salary, etc.
Job Offer Letter.
... A job offer letter should be given to the newly hired employee after you have verbally negotiated the terms of employment. This letter confirms the conditions of employment the selected candidate has accepted and gives them information for their first day." [dhr.idaho.gov/ PDF%20 documents/ Flowchart/ Making%20 the%20 job%20 offer.pdf]
"E-verify.
To ensure compliance with the Governor’s Executive Order 2009-10, all
State Agencies are encouraged to participate in E-verify.
E-verify is an internet based system that allows an employer, using information reported on an employee’s Form I-9, to determine the eligibility of that employee to work in the United States.
The E-Verify system is operated by the U.S. Department of Homeland Security in partnership with the Social Security Administration and its use is free of charge to employers." [dhr.idaho.gov/ PDF%20 documents/ Flowchart/ EVerify%20 Statement.pdf]
"New Hire Paperwork.
There are several important forms for the new employee to fill out." [dhr.idaho.gov/ PDF%20 documents/ Flowchart/ New%20 Hire%20 Paperwork.pdf]
"Probationary Period.
All appointments and promotions into classified positions require a probationary period of 1,040 hours
except for peace officers who must serve 2,080 hours.
The probationary period is a working test period to evaluate the work performance of the employee and to determine their suitability for the position." [dhr.idaho.gov/ PDF%20 documents/ Flowchart/ Probationary%20 Period%20 for%20 Hiring%20 Process.pdf]
The HR infographics example "Hiring process workflow" was created using the ConceptDraw PRO diagramming and vector drawing software extended with the HR Flowcharts solution from the Management area of ConceptDraw Solution Park.
HR infographics
 Business Process Mapping
The Business Process Mapping solution has a collection of vector graphic libraries, pre-made templates, and examples of the business process maps. They are useful for many business specialists including economists, politicians, analysts, and other economic experts, officials and state managers for making the unique and professionally looking drawings. Use it to create an effective Business process map, SIPOC diagram, Swim lanes flowchart and clearly define the necessary business processes due to their inputs and outputs.
How to Draw EPC Diagram Quickly


DFD Flowchart Symbols

Flowchart Software


The vector stencils library "Sales flowchart" contains 62 sales process flow chart symbols.
Use these flow chart icon set to draw your sales flowcharts, workflow diagrams and process charts with the ConceptDraw PRO diagramming and vector drawing software.
The sales process flowchart symbols library "Sales flowchart" is included in the Sales Flowcharts solution from the Marketing area of ConceptDraw Solution Park.
Annotation

Card

Check / audit (diamond)
-sales-flowchart---vector-stencils-library.png--diagram-flowchart-example.png)
Check / audit (square)
-sales-flowchart---vector-stencils-library.png--diagram-flowchart-example.png)
Collate

Comment / note symbol (brace)
-sales-flowchart---vector-stencils-library.png--diagram-flowchart-example.png)
Communication link

Compare (diamond)
-sales-flowchart---vector-stencils-library.png--diagram-flowchart-example.png)
Compare (square)
-sales-flowchart---vector-stencils-library.png--diagram-flowchart-example.png)
Completed form

Concurrency symbol (fork / join)
-sales-flowchart---vector-stencils-library.png--diagram-flowchart-example.png)
Conditional selector

Control transfer

Database

Data input / output

Decision

Decision indicator - No

Decision indicator - Yes

Delay

Direct access storage

Disk storage

Display

Divided process (table view)
-sales-flowchart---vector-stencils-library.png--diagram-flowchart-example.png)
Document

Entity (rounded)
-sales-flowchart---vector-stencils-library.png--diagram-flowchart-example.png)
Event

Extract

Flow line

Internal storage

Junction symbol

Lined document

Lined / shaded process

Loop limit

Manual file

Manual input

Manual operation

Merge

Multi document

Multi process

Off-page reference - arrow
Off-page reference - incoming

Off-page reference - outgoing

On-page reference/ Inspection point

Or

Page

Paper tape

Predefined process

Prepare conditional

Process step

Reference point

Sequential access storage

Sort

Start (circle)
-sales-flowchart---vector-stencils-library.png--diagram-flowchart-example.png)
Start (ellipse)
-sales-flowchart---vector-stencils-library.png--diagram-flowchart-example.png)
Stickman pictogram

Stored data

Summary

Tagged document

Tagged process

Terminal point

Title block

Torso pictogram

The vector stencils library "HR flowchart" contains 62 flowchart symbols.
Use it to draw your HR flowcharts, workflow diagrams and process charts with the ConceptDraw PRO diagramming and vector drawing software.
The flow chart symbols library "HR flowchart" is included in the HR Flowcharts solution from the Management area of ConceptDraw Solution Park.
Use it to draw your HR flowcharts, workflow diagrams and process charts with the ConceptDraw PRO diagramming and vector drawing software.
The flow chart symbols library "HR flowchart" is included in the HR Flowcharts solution from the Management area of ConceptDraw Solution Park.
Annotation

Card

Check / audit (diamond)
-hr-flowchart---vector-stencils-library.png--diagram-flowchart-example.png)
Check / audit (square)
-hr-flowchart---vector-stencils-library.png--diagram-flowchart-example.png)
Collate

Comment / note symbol (brace)
-hr-flowchart---vector-stencils-library.png--diagram-flowchart-example.png)
Communication link

Compare (diamond)
-hr-flowchart---vector-stencils-library.png--diagram-flowchart-example.png)
Compare (square)
-hr-flowchart---vector-stencils-library.png--diagram-flowchart-example.png)
Completed form

Concurrency symbol (fork / join)
-hr-flowchart---vector-stencils-library.png--diagram-flowchart-example.png)
Conditional selector

Control transfer

Data input / output

Database

Decision

Decision indicator - No

Decision indicator - Yes

Delay

Direct access storage

Disk storage

Display

Divided process (table view)
-hr-flowchart---vector-stencils-library.png--diagram-flowchart-example.png)
Document

Entity (rounded)
-hr-flowchart---vector-stencils-library.png--diagram-flowchart-example.png)
Event

Extract

Flow line

Internal storage

Junction symbol

Lined document

Lined / shaded process

Loop limit

Manual file

Manual input

Manual operation

Merge

Multi document

Multi process

Off-page reference - arrow
Off-page reference - incoming

Off-page reference - outgoing

On-page reference/ Inspection point

Or

Page

Paper tape

Predefined process

Prepare conditional

Process step

Reference point

Sequential access storage

Sort

Start (circle)
-hr-flowchart---vector-stencils-library.png--diagram-flowchart-example.png)
Start (ellipse)
-hr-flowchart---vector-stencils-library.png--diagram-flowchart-example.png)
Stickman pictogram

Stored data

Summary

Tagged document

Tagged process

Terminal point

Title block

Torso pictogram

Chemistry Symbols and Meanings

Data Flow Diagram Model

Data Flow Diagram Process

Windows Azure

Value Stream Mapping Symbols

How to Build Cloud Computing Diagram Principal Cloud Manufacturing

HelpDesk
How to Add a Cross-Functional Flowchart to a PowerPoint Presentation

 Event-driven Process Chain Diagrams
Event-Driven Process Chain Diagrams solution extends ConceptDraw DIAGRAM functionality with event driven process chain templates, samples of EPC engineering and modeling the business processes. It includes a vector shape library for drawing the EPC diagrams and EPC flowcharts of any complexity. It is one of EPC IT solutions that assist the marketing experts, business specialists, engineers, educators and researchers in resources planning and improving the business processes using the EPC flowchart or EPC diagram. Use the EPC solutions tools to construct the chain of events and functions, to illustrate the structure of a business process control flow, to describe people and tasks for execution the business processes. Apply it to identify the inefficient business processes in the enterprise and take the corresponding measures required to make them efficient.
The vector stencils library "Cross-functional flowcharts" contains 31 flow chart symbols. Use it for drawing cross-functional and deployment flowcharts the ConceptDraw PRO diagramming and vector drawing software extended with the Cross-Functional Flowcharts solution from the Business Processes area of ConceptDraw Solution Park.
Swimlanes Vertical
Swimlanes Horizontal
Terminator

Process

Decision

Yes
No
YES/NO
Data

Manual Operation

Document

Predefined Process

Stored Data

Internal Storage

Sequential Data

Direct Data

Manual Input

Card

Paper Tape

Display

Preparation

Parallel Mode

Loop limit

On-page Reference

Off-Page Reference (Outgoing)
-cross-functional-flowcharts---vector-stencils-library.png--diagram-flowchart-example.png)
Off-Page Reference (Incoming)
-cross-functional-flowcharts---vector-stencils-library.png--diagram-flowchart-example.png)
Off-page Reference (Circle)
-cross-functional-flowcharts---vector-stencils-library.png--diagram-flowchart-example.png)
Off-Page Reference (Arrow)
-cross-functional-flowcharts---vector-stencils-library.png--diagram-flowchart-example.png)
Annotation
Control Transfer

Condition

Exam Preparation Mind Map

Presentation in MINDMAP All in One


The vector stencils library "Sales flowchart" contains 62 sales process flow chart symbols.
Use these flow chart icon set to draw your sales flowcharts, workflow diagrams and process charts with the ConceptDraw PRO diagramming and vector drawing software.
The sales process flowchart symbols library "Sales flowchart" is included in the Sales Flowcharts solution from the Marketing area of ConceptDraw Solution Park.
Use these flow chart icon set to draw your sales flowcharts, workflow diagrams and process charts with the ConceptDraw PRO diagramming and vector drawing software.
The sales process flowchart symbols library "Sales flowchart" is included in the Sales Flowcharts solution from the Marketing area of ConceptDraw Solution Park.
Annotation
Card
Check / audit (diamond)
Check / audit (square)
Collate
Comment / note symbol (brace)
Communication link
Compare (diamond)
Compare (square)
Completed form
Concurrency symbol (fork / join)
Conditional selector
Control transfer
Database
Data input / output
Decision
Decision indicator - No
Decision indicator - Yes
Delay
Direct access storage
Disk storage
Display
Divided process (table view)
Document
Entity (rounded)
Event
Extract
Flow line
Internal storage
Junction symbol
Lined document
Lined / shaded process
Loop limit
Manual file
Manual input
Manual operation
Merge
Multi document
Multi process
Off-page reference - arrow
Off-page reference - incoming
Off-page reference - outgoing
On-page reference/ Inspection point
Or
Page
Paper tape
Predefined process
Prepare conditional
Process step
Reference point
Sequential access storage
Sort
Start (circle)
Start (ellipse)
Stickman pictogram
Stored data
Summary
Tagged document
Tagged process
Terminal point
Title block
Torso pictogram
Product Overview

- ConceptDraw Arrows10 Technology | Hiring process workflow
- ConceptDraw Arrows10 Technology | ConceptDraw DIAGRAM ...
- ConceptDraw Arrows10 Technology - Marketing backgrounds
- Cross-Functional Flowchart | SYSML | Book Background
- Flow Chart Symbols | White Circle Transparent Background
- Interactions | Interactions | Diagonal Arrow Black Background
- Flow Chart Symbols - Vector clipart library | Identity Card Background
- Cross-Functional Flowchart | SYSML | Books Background Design
- How to Make Different Backgrounds Within a Multipage Drawing ...
- ConceptDraw Solution Park | Cross Icon Transparent Background