Basic of Flowchart: Meaning and Symbols


Diagram Flow Chart

Flowchart Examples and Templates

Audit Flowchart Symbols

Interior Design. Seating Plan — Design Elements

 Cross-Functional Flowcharts
The Cross-Functional Flowcharts solution extends ConceptDraw DIAGRAM software with cross functional flowchart examples, samples, and libraries of cross functional flow chart vector design elements and CH-1 symbols for easy drawing professional-looking and illustrative Cross Functional Flowchart, Cross Functional Diagram, CH-1 Diagram, Process Flowchart, Deployment Flowchart, Opportunity Flowchart, Swimlane Process Mapping Diagram, or Visio Cross Functional Flowchart for planning and further analyzing, optimizing and improvement processes. The use of included pre-made cross functional flowchart template, opportunity flowchart template, and swimlane process map template, greatly easier designing your Cross-functional flowcharts.
 Healthcare Management Workflow Diagrams
Healthcare Management Workflow Diagrams solution contains large set of colorful samples and libraries with predesigned vector pictograms and symbols of health, healthcare equipment, medical instruments, pharmaceutical tools, transport, medication, departments of healthcare organizations, the medical icons of people and human anatomy, flowchart objects, connectors, and arrows, which make it the best for designing clear and comprehensive Medical Workflow Diagrams and Block Diagrams, Healthcare Management Flowcharts and Infographics, Healthcare Workflow Diagram, for depicting the healthcare workflow and clinical workflows in healthcare, for making the workflow analysis healthcare and healthcare workflow management.
 Process Flowcharts
This solution extends ConceptDraw DIAGRAM software with templates, samples, and library of vector shapes for drawing the Process Flowcharts.
Types of Flowchart — Overview


Venn Diagram Examples for Problem Solving

Flowchart Example: Flow Chart of Marketing Analysis

Project —Task Trees and Dependencies

GUI Prototyping with ConceptDraw DIAGRAM

Pyramid Diagram

Concept Map Maker

What is an Organizational Chart and how it works?Organization Chart Software

Work Order Process Flowchart. Business Process Mapping Examples

Holiday Recipes

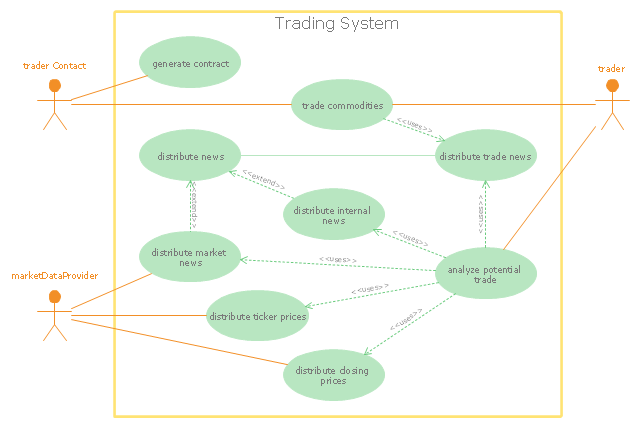
"Algorithmic trading, also called automated trading, black-box trading, or algo trading, is the use of electronic platforms for entering trading orders with an algorithm which executes pre-programmed trading instructions whose variables may include timing, price, or quantity of the order, or in many cases initiating the order by a "robot", without human intervention. Algorithmic trading is widely used by investment banks, pension funds, mutual funds, and other buy-side (investor-driven) institutional traders, to divide large trades into several smaller trades to manage market impact and risk. Sell side traders, such as market makers and some hedge funds, provide liquidity to the market, generating and executing orders automatically.
A special class of algorithmic trading is "high-frequency trading" (HFT), which is often most profitable during periods of high market volatility. During the past years, companies such as Algorates have employed HFT strategies, recording high profits even during periods in which the markets have seen steep declines." [Algorithmic trading. Wikipedia]
The UML use case diagram example "Trading system usage scenarios" was created using the ConceptDraw PRO diagramming and vector drawing software extended with the Rapid UML solution from the Software Development area of ConceptDraw Solution Park.
UML use case diagram
- Basic Flowchart Symbols and Meaning | Manual Loop Flowchart
- Types of Flowchart - Overview | Basic Flowchart Symbols and ...
- Types of Flowcharts | Basic Flowchart Symbols and Meaning | Flow ...
- Basic Flowchart Symbols and Meaning | Accounting Flowchart ...
- Basic Flowchart Symbols and Meaning | How to Remove ...
- Basic Flowchart Symbols and Meaning | Flow Chart Symbols ...
- Database Flowchart Symbols | SDL Flowchart Symbols | Basic of ...
- Basic Flowchart Symbols and Meaning | Types of Flowcharts ...
- Basic Flowchart Symbols and Meaning | Sales Process Flowchart ...
- Basic Flowchart Symbols and Meaning | Flow Chart Symbols ...