Made with
ConceptDraw
DIAGRAM 18

Biodiversity

The environmental, social, and governance (ESG) metrics have an impact in different areas. They help to build a resilient business, impact performance, risk management, and other factors. The environmental component includes protecting the environment from pollution and climate change and saving biodiversity. The issues of climate change and biodiversity loss are closely interrelated.

Biodiversity is a variety and variability of life on Earth at all levels, from certain regions to entire ecosystems. It includes all species diversity and species richness of terrestrial and marine inhabitants, flora representatives, bacterias, and other living beings, and also evolutionary, ecological, genetic, and cultural processes of life.

Over generations, the enormous amount of species that are currently alive today have developed and received unique traits, the food chains and interrelationships have formed. Meanwhile, biodiversity is not distributed evenly, both within regions and in the entire world. It depends on geography, climate, temperature, altitude, soils, precipitation, the presence of other species, and many other factors. Ecosystems that host the most biodiversity tend to have ideal environmental conditions for animals and plants. And the main aim of the current generation is to save these conditions, preserve biodiversity, protect endangered species and their habitats. As a rule, biodiversity is greater in the warm climate, tropics, wet rain forests, regions near the equator. It concerns both flora and fauna. The marine biodiversity is higher along coasts in the Western Pacific. It is also discovered that terrestrial biodiversity is around 25 times greater than ocean biodiversity.

Since life began on Earth, several mass extinctions have led to large and sudden drops in biodiversity. Currently, biodiversity reduction and loss of genetic diversity occur as a result of human impacts. At the same time, many species provide important benefits to humans and other species. The biodiversity loss affects the quality of the water, air, and soil, causes the depletion of natural resources, and changes in weather patterns.

Currently, the Earth’s biodiversity is at risk of loss through human consumption and human activities that disturb and destroy ecosystems. These include pollution, population growth, climate change, deforestation, and unsustainable use of existing resources. The species extinction rises, moreover rapid environmental changes often cause immediate mass extinctions.

Biodiversity and Food

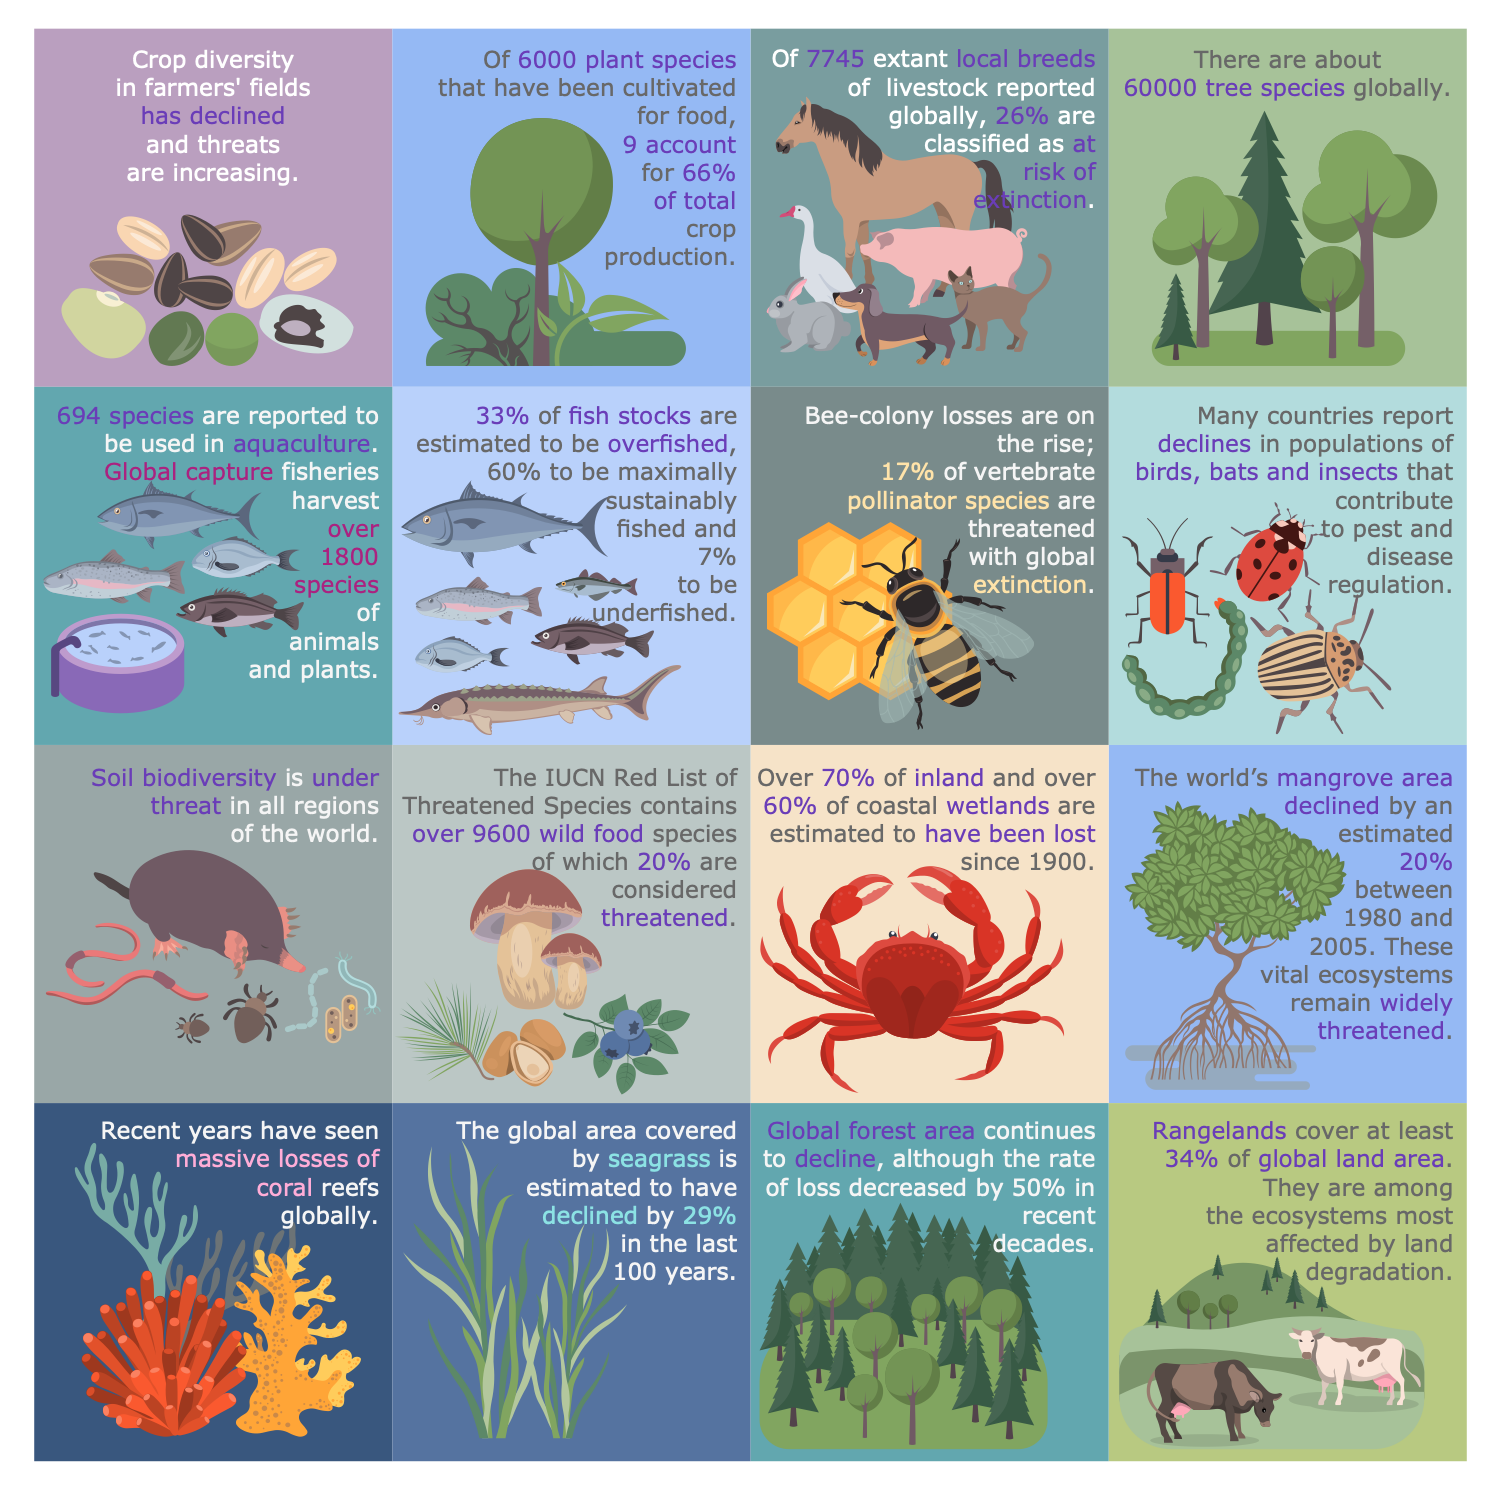
Example 1. Biodiversity and Food

Biodiversity is a critical consideration for investors. In order to make rational investments, the investors analyze both how responsible the companies are according to managing biodiversity, their impact on it, and management of biodiversity risks. The preference is given to the companies that position themselves as sustainable in environmental, social, and governance directions. In some cases, the biodiversity loss causes a range of risks for the companies, impacts their ability to operate and get a large profit. As a result, it affects an economy of a certain region.

Biodiversity protection is also one of the key aims of the UN, because the effects of loss can become irreversible and unprecedented.

Sustaining Biodiversity Library Design Elements

Example 2. Sustaining Biodiversity Library Design Elements

Environmental, Social, and Corporate Governance solution for ConceptDraw DIAGRAM software helps to design efficiently infographics and diagrams related to ESG, show the impact of ESG-based companies on the environment and climate change, ways to save biodiversity, and advantages of using renewable energy. It is useful in all stages of business development, for both companies and investors. This solution includes a large variety of examples and samples, and a collection of pre-made vector design elements, clipart, and pictograms. The variety of schematics that you can design using them is enormous.

The list of libraries of the Environmental, Social, and Corporate Governance solution includes:

  • Corporate Governance
  • Environmental Impact
  • Life Cycle Assessment
  • Renewable Energy and Resources
  • Social Impact
  • Sustaining Biodiversity

ESG Infographics - Climate Change and Ocean

Example 3. ESG Infographics - Climate Change and Ocean

The ESG infographic samples you see on this page were created in ConceptDraw DIAGRAM software using the drawing tools of the Environmental, Social, and Corporate Governance Solution. These examples successfully demonstrate the solution's capabilities and professional results you can achieve using it. An experienced user spent 5-10 minutes creating each of these samples.

Use the drawing tools of the Environmental, Social, and Corporate Governance solution to design your own ESG Infographics quick, easy, and effective.

All source documents are vector graphic documents. They are available for reviewing, modifying, or converting to a variety of formats (PDF file, MS PowerPoint, MS Visio, and many other graphic formats) from the ConceptDraw STORE. The Environmental, Social, and Corporate Governance Solution is available for ConceptDraw DIAGRAM users.


TEN RELATED HOW TO's:
When trying to figure out the nature of the problems occurring within a project, there are many ways to develop such understanding. One of the most common ways to document processes for further improvement is to draw a process flowchart, which depicts the activities of the process arranged in sequential order — this is business process management. ConceptDraw DIAGRAM is business process mapping software with impressive range of productivity features for business process management and classic project management. This business process management software is helpful for many purposes from different payment processes, or manufacturing processes to chemical processes. Business process mapping flowcharts helps clarify the actual workflow of different people engaged in the same process. This samples were made with ConceptDraw DIAGRAM — business process mapping software for flowcharting and used as classic visio alternative because its briefly named "visio for mac" and for windows, this sort of software named the business process management tools. This flowchart diagram shows a process flow of project management. The diagram that is presented here depicts the project life cycle that is basic for the most of project management methods. Breaking a project into phases allows to track it in the proper manner. Through separation on phases, the total workflow of a project is divided into some foreseeable components, thus making it easier to follow the project status. A project life cycle commonly includes: initiation, definition, design, development and implementation phases. Distinguished method to show parallel and interdependent processes, as well as project life cycle relationships. A flowchart diagram is often used as visual guide to project. For instance, it used by marketing project management software for visualizing stages of marketing activities or as project management workflow tools. Created with ConceptDraw DIAGRAM — business process mapping software which is flowcharting visio alternative or shortly its visio for mac, this sort of software platform often named the business process management tools.Process Flowchart
Picture: Process Flowchart: A Step-by-Step Comprehensive Guide
Related Solution:
Compare desktop flowchart software for Mac and Windows. Evaluate templates, symbol libraries, export formats, file control, and workflow fit for long-term documentation.Desktop flowchart editor workspace on Mac and Windows
Picture: Professional Flowchart Software for Mac & Windows
Related Solution:
A database is a data collection, structured into some conceptual model. Two most common approaches of developing data models are UML diagrams and ER-model diagrams. There are several notations of entity-relationship diagram symbols and their meaning is slightly different. Crow’s Foot notation is quite descriptive and easy to understand, meanwhile, the Chen notation is great for conceptual modeling. An entity relationship diagrams look very simple to a flowcharts. The main difference is the symbols provided by specific ERD notations. There are several models applied in entity-relationship diagrams: conceptual, logical and physical. Creating an entity relationship diagram requires using a specific notation. There are five main components of common ERD notations: Entities, Actions, Attributes, Cardinality and Connections. The two of notations most widely used for creating ERD are Chen notation and Crow foot notation. By the way, the Crow foot notation originates from the Chen notation - it is an adapted version of the Chen notation.ERD Symbols and Meanings
Picture: ERD Symbols and Meanings
Related Solution:
ConceptDraw DIAGRAM - workflow software extended with the Workflow Diagram solution provides a complete set of samples, templates and features help you to draw diagrams faster. A workflow software you use for drawing workflow diagrams and business process flow diagrams should provide a wide set of examples allows you get closer with workflow diagrams, learn symbols meaning, find appropriate layout and design, and then start drawing your own workflow diagram masterfully. Workflow diagrams used for orchestrating organizational processes between company departments and humans, so critical process diagrams used to train many people to interact must be clear and professional to convey an idea from a view. Thats a reason we created a lot workflow symbols and workflow icons collected them into special Workflow Diagram solution in ConceptDraw Solution Park.Workflow Diagram Examples *
Picture: Workflow Diagram Examples
Related Solution:
If you are just a beginner in drawing flowcharts, it may seem that a sheet of paper and a pen are just enough. However, at the time you would want to share your results, diagramming applications would suite you better. it’s very easy to create diagrams that way and to discover new kinds of flowcharts. The huge collection of sample ConceptDraw diagrams, charts, illustrations and other types of business drawings includes a wide range of business themes. A huge number of graphic images of ConceptDraw documents is divides on business application areas according to business-oriented solutions for which they were made.Here is a short visual list of samples of flowcharts, process diagrams, UML models, management charts, computer network diagrams, maps, infographics, illustrations, etc. In short, each ConceptDraw solution is accompanied with at least ten samples representing some particular examples of the application of the given chart.Applications *
Picture: Applications
When thinking about data visualization, one of the first tools that comes to mind is a flowchart design. You can find flowchart symbols, shapes, stencils and icons easily on the Internet, but it might take time to systematize this information. Nevertheless, once you start flowcharting, you’ll love its simplicity and efficiency. This diagram consists from standard flowchart symbols, approved by ANSI (American National Standard Institute) for drawing flowcharts. A flowchart is a diagram that represents a step-by-step algorithm of any process, displaying the process stages as boxes that are connected with arrows. Flowchart design makes it clear and readable. Flowchart designed using ConceptDraw DIAGRAM flowchart software allows to make attractive and clear process presentation, it makes interpretation of the business process flow fresh and versatile. Great flowchart design view is a big advantage over the diagram created manually on a paper.Flowchart design
Picture:
Flowchart Design
Flowchart Symbols, Shapes, Stencils and Icons
Related Solution:
It can be tough to get straight into business papers and processes.Otherwise, you can learn how to create flowcharts for an accounting information system and visualize these documents. Accounting diagrams are clear and easy to understand for all the participants of the process. There are symbols used for creating accounting flowcharts using ConceptDraw DIAGRAM and its Accounting Flowcharts solution. Accounting flow charts are a special kind of flow charts. Actually a variety of flowcharts are often used to facilitate many aspects of a workflow of accounting department. Accounting flowcharts are utilized to support creating accounting documentation, to depict positions responsible for fulfillment of each phase of accounting workflow.How to Create Flowcharts for an Accounting Information System
Picture:
How to Create Flowcharts for an
Accounting Information System
Related Solution:
A flowchart is a powerful tool for examining processes. It helps improving processes a lot, as it becomes much easier to communicate between involved people, to identify potential problems and to optimize workflow. There are flowcharts of different shapes, sizes and types of flowchart vary from quite basic process flowcharts to complex program flowcharts. Nevertheless, all these diagrams use the same set of special symbols like arrows to connect blocks, parallelogram to show data receiving or rectangles for showing process steps. Basic flowcharts are used to represent a simple process algorithm. A basic flowchart notation consists of rectangles (business processes), arrows (the flow of information, documents, etc.). The same notation is used in items such as the "decision", which allow you to do the branching. To indicate the start of the entire business process and its termination can be used the "Terminator" element. The advantages of Basic Flowchart are simplicity and clarity. With it you can quickly describe the business process steps. Creating of Basic Flowchart does not require any special knowledge, as easily understand by employees with different levels of education and IQ.Types of Flowchart — Overview
Picture: Types of Flowchart: Comprehensive Overview
Related Solution:
There are many ways to track the system in a critical situation. To model a system behavior, uml notation is widely used. Usually, an UML diagram consists of elements such as actor and a case. This diagram represents the structure of UML notations. Unified Modeling Language (UML) is used in software engineering to depict graphically the software modeling process. UM Language uses graphic notations for developing models of object-oriented systems. These notations displays requirements, sub-systems, logical and physical elements, etc. We created this diagram using ConceptDraw DIAGRAM reinforced with Rapid UML solution. It can be helpful for students on software engineering, when learning UML.UML Notation *
Picture: UML Notation
Related Solution:
Local area network connects computers and other network appliances within an area, such as office building or a campus. It can be difficult to provide such network without a predesigned plan. For these purposes you can use network diagram software, which helps you to create LAN network diagrams and office network diagrams quickly and effortless. This will speed up your work and you can save the diagram for the future network improvements. The following diagram illustrates a network topology of the small office. LAN configuration has a star topology. The local network joins 8 computers among which are several desktop PCs, laptop, two iMacs and iBook. The end-point devices are divided into three groups. Each group is connected to its hub. There is a network printer and a modem, which are interconnected with other devices through a network server. Each computer on the LAN can access the server through a corresponding hub.LAN Network Diagram
Picture: Network Diagram Software. LAN Network Diagrams. Physical Office Network Diagrams
Related Solution:
ConceptDraw
DIAGRAM 18