What is Interactive Flowcharts

Interactive Flowcharts can change the way one creates and organizes their social media response process.
Create Response Charts

Social Media Response DFD Flowcharts - diagramming software ( Mac PC )


HelpDesk
How to Organize a Social Media Activity
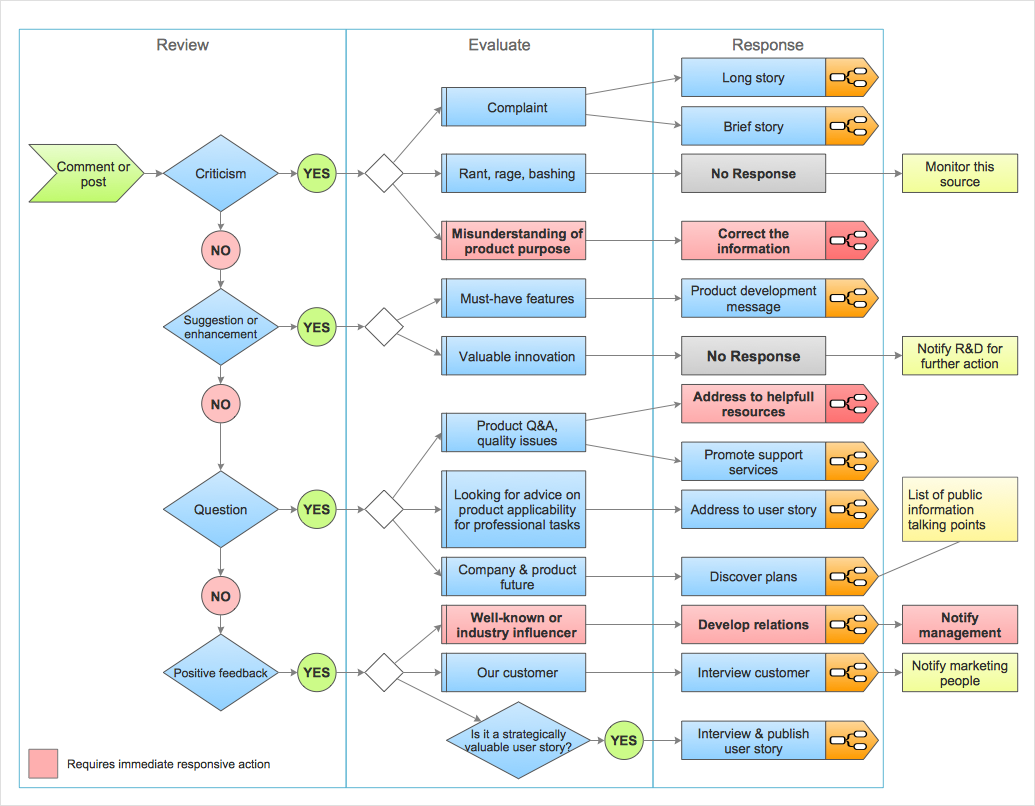
 Social Media Response
This solution extends ConceptDraw DIAGRAM and ConceptDraw MINDMAP with the ability to draw interactive flow charts with action mind map templates, to help create an effective response to applicable social media mentions.
Social Media Response Management DFD Charts - software tools

How to Create a Social Media DFD Flowchart

It allows companies to be more effective in timely messaging thanks to the ability for rapid response to a customer′s post in social media. This saves budget for companies who use social media for promoting and as a lead generation tool.
Social Media Flowchart Symbols

How to Connect Social Media DFD Flowchart with Action Maps

HelpDesk
How to Create an Interactive Voice Response (IVR) Diagram
 Diagram")
 Interactive Voice Response Diagrams
Interactive Voice Response Diagrams solution extends ConceptDraw DIAGRAM software with samples, templates and libraries of ready-to-use vector stencils that help create Interactive Voice Response (IVR) diagrams illustrating in details a work of interactive voice response system, the IVR system’s logical and physical structure, Voice-over-Internet Protocol (VoIP) diagrams, and Action VoIP diagrams with representing voice actions on them, to visualize how the computers interact with callers through voice recognition and dual-tone multi-frequency signaling (DTMF) keypad inputs.
 ConceptDraw Solution Park
ConceptDraw Solution Park collects graphic extensions, examples and learning materials
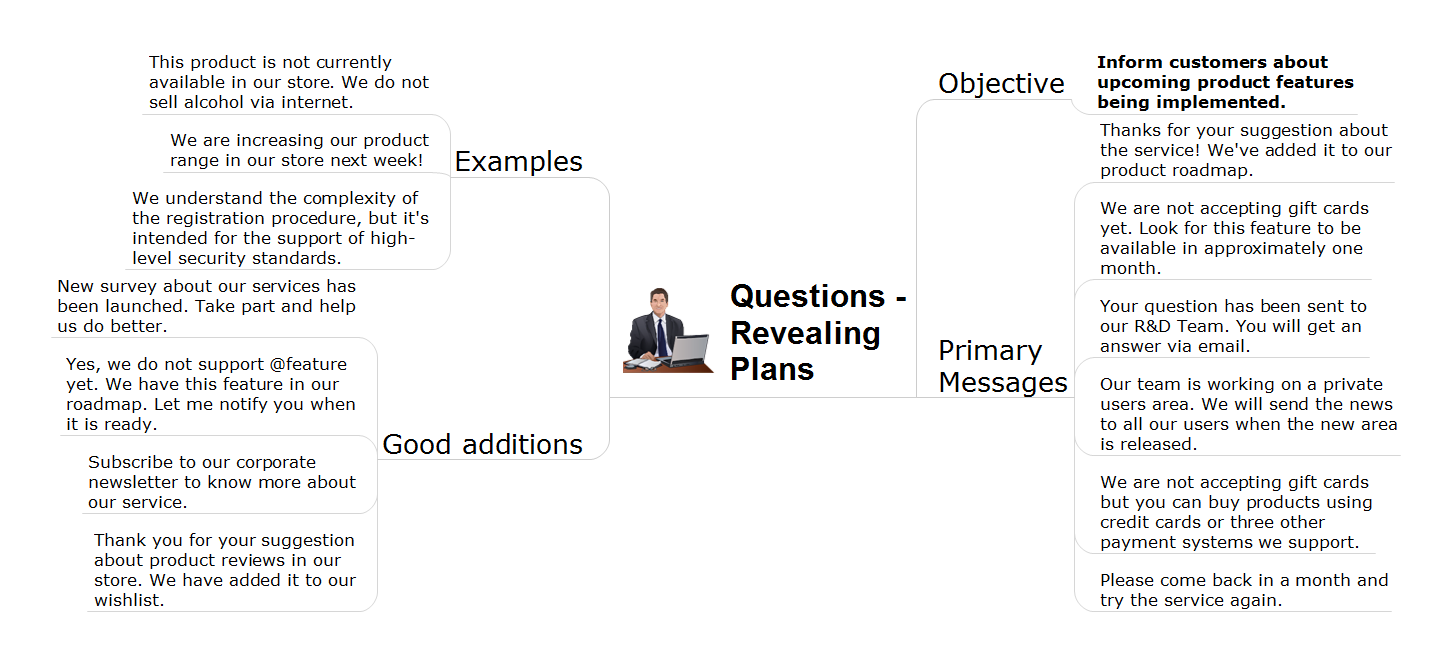
The Means to Respond to Social Media Mentions
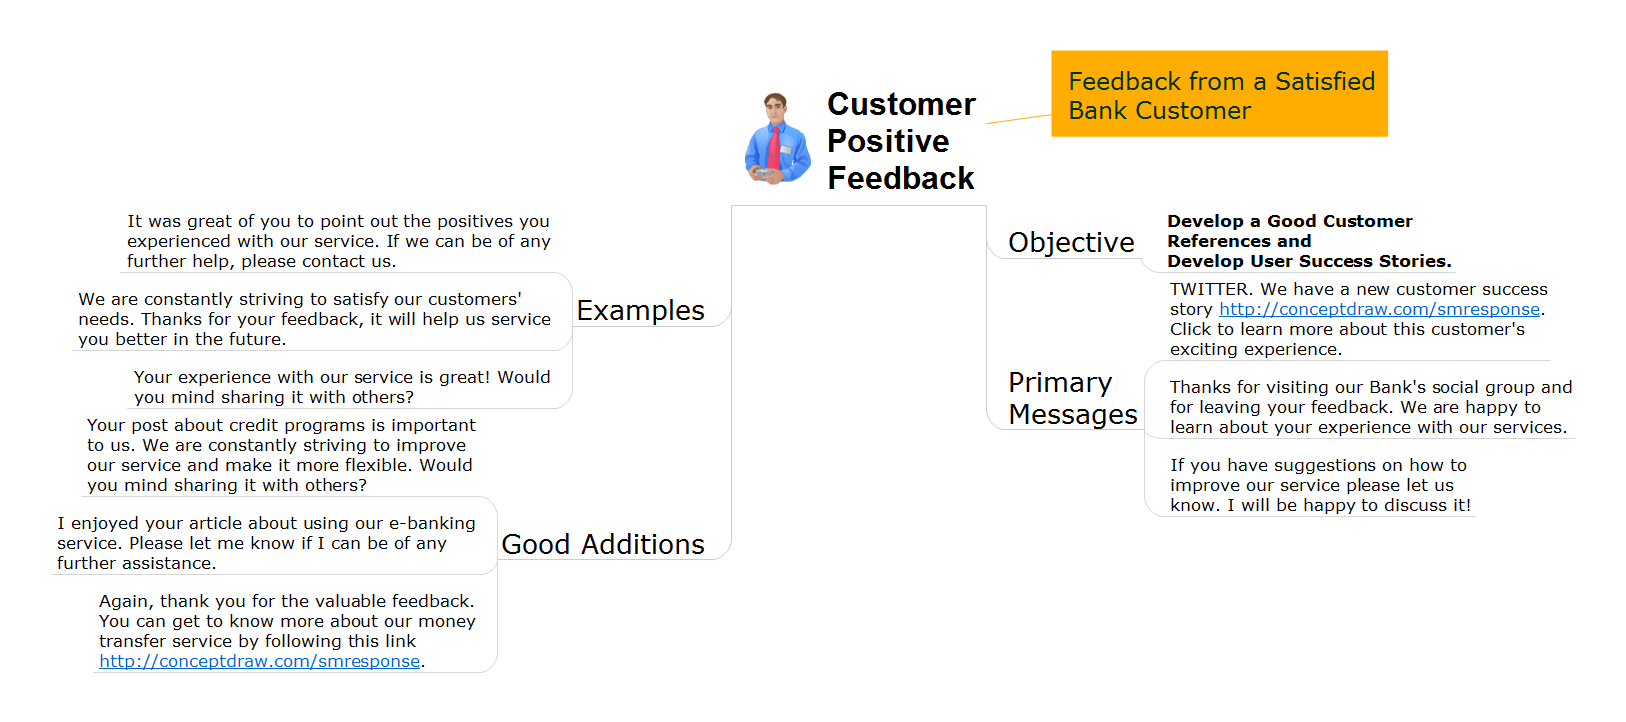
Provide Team Training
HelpDesk
How to Use ConceptDraw Sales Dashboard Solution

- What is Interactive Flowcharts | Create Response Charts | How to ...
- Cross-Functional Flowcharts | Accounting Flowcharts | What is ...
- What is Interactive Flowcharts | Create Response Charts | Social ...
- Types of Flowchart - Overview | Create Response Charts | What is ...
- What is Interactive Flowcharts | How to Create a Sales Dashboard ...
- Flow Chart Online | What is Interactive Flowcharts | How to Create a ...
- Cross-Functional Flowcharts | What is Interactive Flowcharts ...
- Create Response Charts | What is Interactive Flowcharts | How to ...
- What is Interactive Flowcharts | Cross-Functional Flowchart (Swim ...
- Social Media Response | What is Interactive Flowcharts | How to ...
- Examples of Flowcharts , Org Charts and More | What is Interactive ...
- How to Create a Social Media DFD Flowchart | What is Interactive ...
- Interactive Training Tool | What is Interactive Flowcharts | Interactive ...
- Flow chart Example. Warehouse Flowchart | Process Flowchart ...
- Cross-Functional Flowcharts | Types of Flowcharts | What is ...
- What is Interactive Flowcharts | Flowchart Program Mac | Program to ...
- Project Management Area | Basic Flowchart Symbols and Meaning ...
- Applications | Program Structure Diagram | What is Interactive ...
- ConceptDraw Solution Park | What is Interactive Flowcharts | Cross ...
- Best Flowchart Software | Create Flowchart | What is Interactive ...
- ERD | Entity Relationship Diagrams, ERD Software for Mac and Win
- Flowchart | Basic Flowchart Symbols and Meaning
- Flowchart | Flowchart Design - Symbols, Shapes, Stencils and Icons
- Flowchart | Flow Chart Symbols
- Electrical | Electrical Drawing - Wiring and Circuits Schematics
- Flowchart | Common Flowchart Symbols
- Flowchart | Common Flowchart Symbols