Action Maps helps the teams be on the same page and follow the social media response plan.
TEN RELATED HOW TO's:
ConceptDraw DIAGRAM Comparison with Omnigraffle Professional and MS Visio. All source ConceptDraw documents are vector graphic documents. They are available for reviewing, modifying, or converting to a variety of formats: PDF file, MS PowerPoint, MS Visio, and many other graphics formats.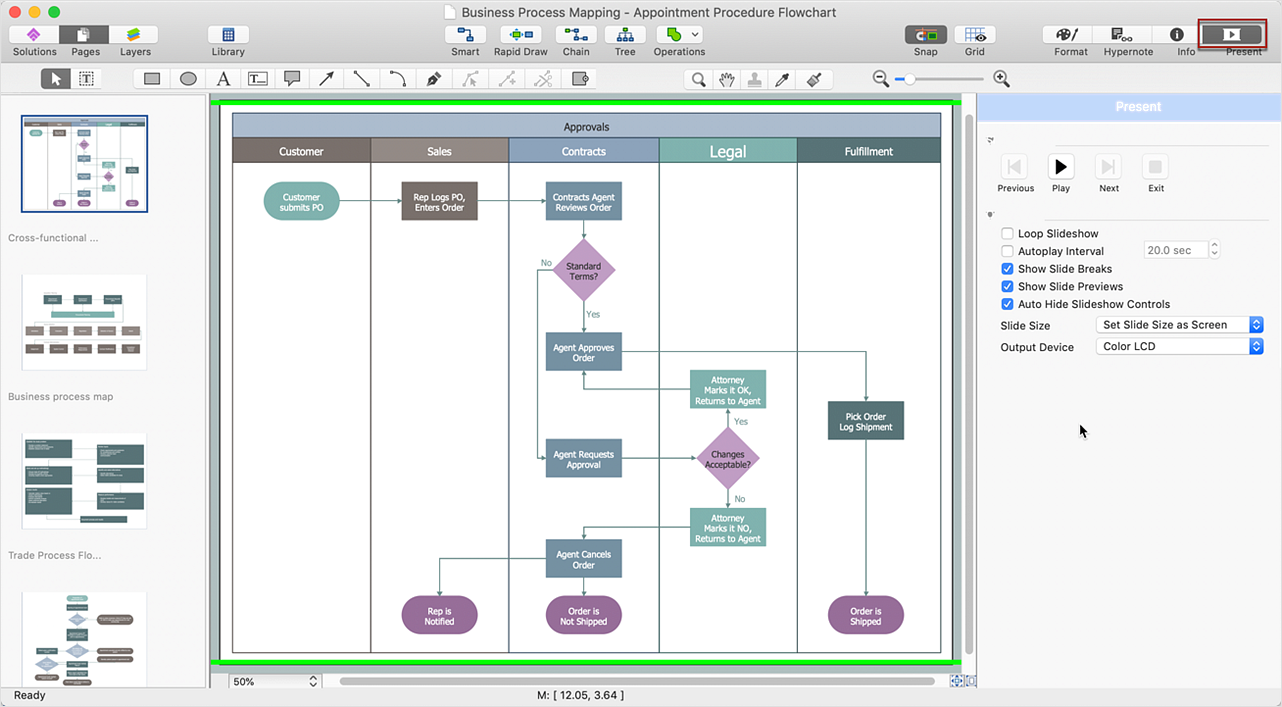
Picture: ConceptDraw DIAGRAM Comparison with Omnigraffle Professional and MS Visio
Related Solution:
This mind map demonstrates how the well-known Total Quality Management (TQM) methodology can be presented in a mind map. Using mind mapping for quality management is a creative approach that allows one to structure all key quality points on the one page.
Picture: Total Quality Management
Related Solution:
ConceptDraw is your tool for driving social integration and managing change across and streamline social media processes of your organisation.This tool keeps the entire team on the same page allowing you to realize your social media strategy, improve the quality of your answers, and minimize the time it takes to respond.
Picture: Social Media Response Management DFD Charts - software tools
Related Solution:
While creating flowcharts and process flow diagrams, you should use special objects to define different statements, so anyone aware of flowcharts can get your scheme right. There is a short and an extended list of basic flowchart symbols and their meaning. Basic flowchart symbols include terminator objects, rectangles for describing steps of a process, diamonds representing appearing conditions and questions and parallelograms to show incoming data.
This diagram gives a general review of the standard symbols that are used when creating flowcharts and process flow diagrams. The practice of using a set of standard flowchart symbols was admitted in order to make flowcharts and other process flow diagrams created by any person properly understandable by other people. The flowchart symbols depict different kinds of actions and phases in a process. The sequence of the actions, and the relationships between them are shown by special lines and arrows. There are a large number of flowchart symbols. Which of them can be used in the particular diagram depends on its type. For instance, some symbols used in data flow diagrams usually are not used in the process flowcharts. Business process system use exactly these flowchart symbols.
Picture: Flowchart Symbols: Meaning and Examples
Related Solution:
A model of a system is defined as a set of hierarchical diagrams representing the asynchronous process of data transformation from the moment it is input to the system to the moment it is output to the user. To demonstrate how a process transforms the initial data, you should design a data flow diagram using a DFD Library included in ConceptDraw DIAGRAM Solution Park. Start your diagramming experience now!
You can use this library of symbols related to data flow diagrams (DFD) to design data-oriented or process-oriented models along with data process diagrams. This vector objects library It is a part of ConceptDraw solution designed for data flow diagramming, along with corresponding samples and templates. A data flow diagram is a 2D flowchart that depicts the sequence of particular activities and operations operations and activities which is accompanied by the dynamic flow of some data.
Picture: Design Data Flow. DFD Library
Related Solution:
Presentation tools. A convenient tool to present documents via Skype. Share your desktop, collaborate on documents in real-time and run a web conference one-on-one or one-to-many.
A tool for sharing and presenting business documents via Skype. Allows to present Microsoft® Word®, Microsoft PowerPoint®, Microsoft Project® and plenty mindmapping formats.
Picture: Presenting Documents with Skype
Related Solution:
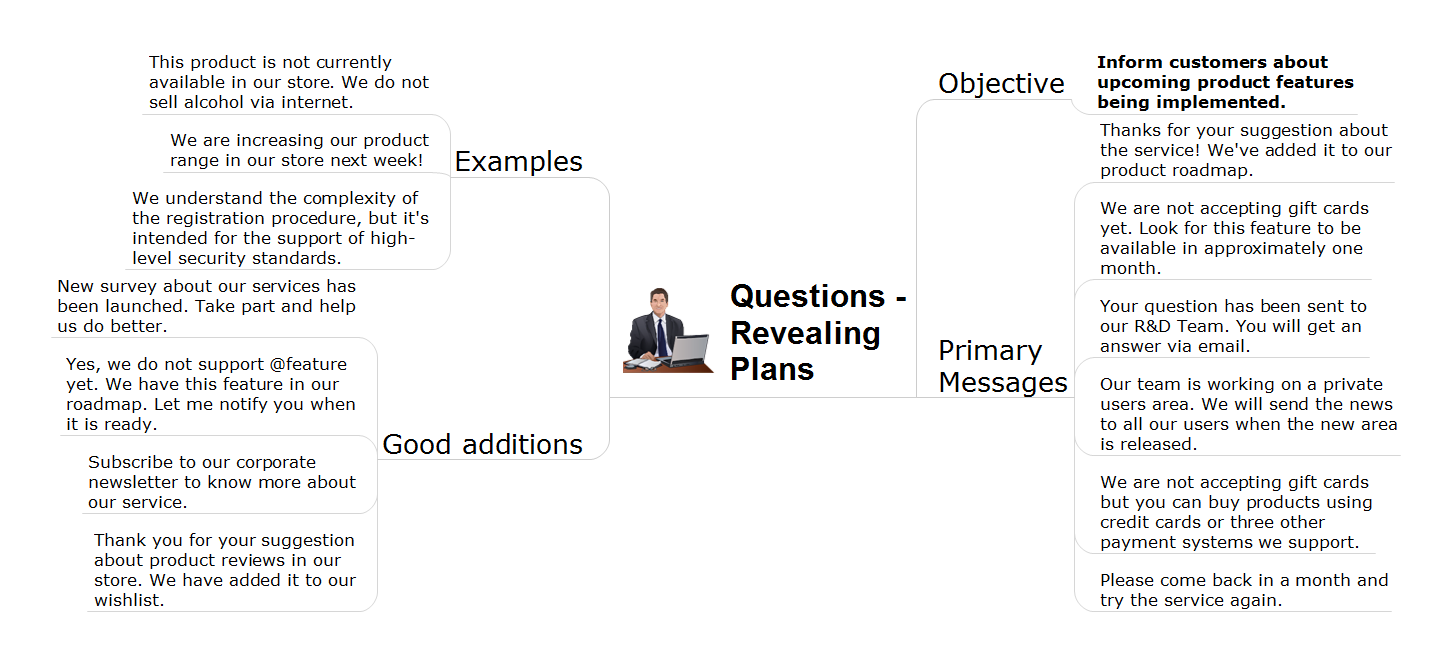
Interactive tool helps you find the appropriate response to social media mentions quickly. There are materials to help trainers and consultants develop a social media strategy and provide training for social media groups on how to effectively accomplish their daily work.
Picture: How to Present a Social Media Response Plan DFD to Your Team
Related Solution:
The Total Quality Management Diagram solution helps you and your organization visualize business and industrial processes. Create Total Quality Management diagrams for business process with ConceptDraw software.
Picture: TQM Diagram Tool
Related Solution:
ConceptDraw DIAGRAM software supplied with HR Flowcharts Solution can effectively help in labour-intensive process of human resource development.
Picture: Human Resource Development
Related Solution:
A perfect visual tool for presenting to a remote group via Skype. Participants receives document automatically. Participants are able to edit presentation after session. Helpful for webinars, online meetings, remote learning.
Picture: Remote Learning Sessions - Webinars
Related Solution: