A four level pyramid model of different types of Information Systems based on the different levels of hierarchy in an organization. The first level represents transaction processing systems for workers. The second level represents management information systems for middle managers. The third level represents decision support systems for senior menegers. The fourth level represents executive information systems for executives.
"The "classic" view of Information systems found in the textbooks in the 1980s was of a pyramid of systems that reflected the hierarchy of the organization, usually transaction processing systems at the bottom of the pyramid, followed by management information systems, decision support systems, and ending with executive information systems at the top. Although the pyramid model remains useful, since it was first formulated a number of new technologies have been developed and new categories of information systems have emerged, some of which no longer fit easily into the original pyramid model.
Some examples of such systems are:
data warehouses,
enterprise resource planning,
enterprise systems,
expert systems,
search engines,
geographic information system,
global information system,
office automation." [Information systems. Wikipedia]
This diagram was redesigned using the ConceptDraw PRO diagramming and vector drawing software from Wikimedia Commons file Four-Level-Pyramid-model.png. [commons.wikimedia.org/ wiki/ File:Four-Level-Pyramid-model.png]
This file is licensed under the Creative Commons Attribution-Share Alike 3.0 Unported license. [creativecommons.org/ licenses/ by-sa/ 3.0/ deed.en]
The triangle chart example "Information systems types" is included in the Pyramid Diagrams solution from the Marketing area of ConceptDraw Solution Park.
Pyramid diagram

Pyramid Diagram

A five level pyramid model of different types of Information Systems based on the information processing requirement of different levels in the organization. The first level represents transaction processing systems to process basic data. The second level represents office support systems to process information in office. The third level represents management information systems to process information by managers. The fourth level represents decision support systems to process explicit knowledge. The fifth level represents executive information systems to process tacit knowledge.
"A Computer(-Based) Information System is essentially an IS using computer technology to carry out some or all of its planned tasks. The basic components of computer based information system are:
(1) Hardware - these are the devices like the monitor, processor, printer and keyboard, all of which work together to accept, process, show data and information.
(2) Software - are the programs that allow the hardware to process the data.
(3) Databases - are the gathering of associated files or tables containing related data.
(4) Networks - are a connecting system that allows diverse computers to distribute resources.
(5) Procedures - are the commands for combining the components above to process information and produce the preferred output.
The first four components (hardware, software, database and network) make up what is known as the information technology platform. Information technology workers could then use these components to create information systems that watch over safety measures, risk and the management of data. These actions are known as information technology services." [Information systems. Wikipedia]
This pyramid diagram was redesigned using the ConceptDraw PRO diagramming and vector drawing software from Wikimedia Commons file Five-Level-Pyramid-model.png. [commons.wikimedia.org/ wiki/ File:Five-Level-Pyramid-model.png]
This file is licensed under the Creative Commons Attribution 3.0 Unported license. [creativecommons.org/ licenses/ by/ 3.0/ deed.en]
The triangle chart example "Information systems types" is included in the Pyramid Diagrams solution from the Marketing area of ConceptDraw Solution Park.
Pyramid diagram

Pyramid Diagram

five level pyramid example is included in the Pyramid Diagrams solution from Marketing area of ConceptDraw Solution Park.
Pyramid Diagram

Types of Flowcharts


How to Create Flowcharts for an Accounting Information System

Flowcharts help users of Accounting Information System to understand the step sequences of accounting processes. Use ConceptDraw DIAGRAM with Accounting Flowcharts solution to document and communicate visually how accounting processes work, and how each operation is done.
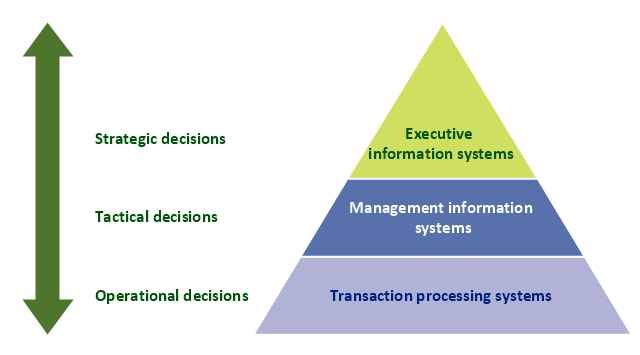
A three level pyramid model of different types of Information Systems based on the type of decisions taken at different levels in the organization. The first level represents transaction processing systems focused on operational decisions.
The second level represents management information systems focused on tactical decisions. The third level represents executive information systems focused on strategic decisions.
"Information system (IS) is the study of complementary networks of hardware and software (see information technology) that people and organizations use to collect, filter, process, create, and distribute data.
The study bridges business and computer science using the theoretical foundations of information and computation to study various business models and related algorithmic processes within a computer science discipline.
Computer information system(s) (CIS) is a field studying computers and algorithmic processes, including their principles, their software and hardware designs, their applications, and their impact on society while IS emphasizes functionality over design.
Any specific information system aims to support operations, management and decision making. In a broad sense, the term is used to refer not only to the information and communication technology (ICT) that an organization uses, but also to the way in which people interact with this technology in support of business processes." [Information systems. Wikipedia]
This diagram was redesigned using the ConceptDraw PRO diagramming and vector drawing software from Wikimedia Commons file Three-Level-Pyramid-model.png. [commons.wikimedia.org/ wiki/ File:Three-Level-Pyramid-model.png]
This file is licensed under the Creative Commons Attribution 3.0 Unported license. [creativecommons.org/ licenses/ by/ 3.0/ deed.en]
The triangle chart example "Information systems types" is included in the Pyramid Diagrams solution from the Marketing area of ConceptDraw Solution Park.
Pyramid diagram
Pyramid Diagram

Data Flow Diagram

- 4 Level pyramid model diagram - Information systems types ...
- Pyramid Diagram | 4 Level pyramid model diagram - Information ...
- 4 Level pyramid model diagram - Information systems types | How to ...
- 4 Level pyramid model diagram - Information systems types | With ...
- 5 Level pyramid model diagram - Information systems types | Draw ...
- 5 Level pyramid model diagram - Information systems types | 4 Level ...
- 5 Level pyramid model diagram - Information systems types | Rapid ...
- 4 Level pyramid model diagram - Information systems types | 5 Level ...
- Accounting Information Systems Flowchart Symbols | 4 Level ...
- 5 Level pyramid model diagram - Information systems types ...
- ERD | Entity Relationship Diagrams, ERD Software for Mac and Win
- Flowchart | Basic Flowchart Symbols and Meaning
- Flowchart | Flowchart Design - Symbols, Shapes, Stencils and Icons
- Flowchart | Flow Chart Symbols
- Electrical | Electrical Drawing - Wiring and Circuits Schematics
- Flowchart | Common Flowchart Symbols
- Flowchart | Common Flowchart Symbols