Bar Chart Examples

 Fishbone Diagram
Fishbone Diagrams solution extends ConceptDraw PRO software with templates, samples and library of vector stencils for drawing the Ishikawa diagrams for cause and effect analysis.
Basketball Plays Software
ConceptDraw PRO diagramming and vector drawing software extended with Basketball solution from the Sport area of ConceptDraw Solution Park is a very useful tool for designing the basketball-related diagrams of any complexity.
 Basic Bar Graphs
This solution enhances ConceptDraw PRO v10.3.0 (or later) with templates, samples and a library of vector stencils for drawing Bar Graphs.
Types of Flowchart - Overview


Create Soccer (Football) Positions
 Positions")
The vector stencils library "Soccer pictograms" contains 27 association football pictograms clipart.
Use these shapes for designing your sport infographics, webpages, illustrations and presentations in the ConceptDraw PRO diagramming and vector drawing software extended with the Soccer solution from the Sport area of ConceptDraw Solution Park.
www.conceptdraw.com/ solution-park/ sport-soccer
Use these shapes for designing your sport infographics, webpages, illustrations and presentations in the ConceptDraw PRO diagramming and vector drawing software extended with the Soccer solution from the Sport area of ConceptDraw Solution Park.
www.conceptdraw.com/ solution-park/ sport-soccer
Footballer

Footballer

Footballer

Footballer

Footballer

Footballer

Goalkeeper

Goalkeeper

Goalkeeper

Referee

Referee

Referee

Soccer field
Whistle

Football ball

Football sneakers

Goal
Gate
Champion cup

Score

Referee shirt
Footballer shirt

Soccer referee flag

Soccer referee flag

Soccer referee flag

Soccer uniform
Stopwatch

 Area Charts
Area Charts are used to display the cumulative totals over time using numbers or percentages; or to show trends over time among related attributes. The Area Chart is effective when comparing two or more quantities. Each series of data is typically represented with a different color, the use of color transparency in an object’s transparency shows overlapped areas and smaller areas hidden behind larger areas.
Venn Diagram Examples for Problem Solving. Environmental Social Science. Human Sustainability Confluence

Create your Venn diagrams for problem solving in environmental social science using the ConceptDraw PRO diagramming and vector drawing software extended with the Venn Diagrams solution from the area "Diagrams" of ConceptDraw Solution Park.
How to Create a Bar Chart

Soccer (Football) Positions
 Positions")
Soccer (Football) Formation
 Formation 2—3—5 Pyramid")
This sport field plan sample was designed on the base of the Wikipedia file: VolleyballCourt.svg. [en.wikipedia.org/ wiki/ File:VolleyballCourt.svg]
This file is licensed under the Creative Commons Attribution-Share Alike 3.0 Unported license. [creativecommons.org/ licenses/ by-sa/ 3.0/ deed.en]
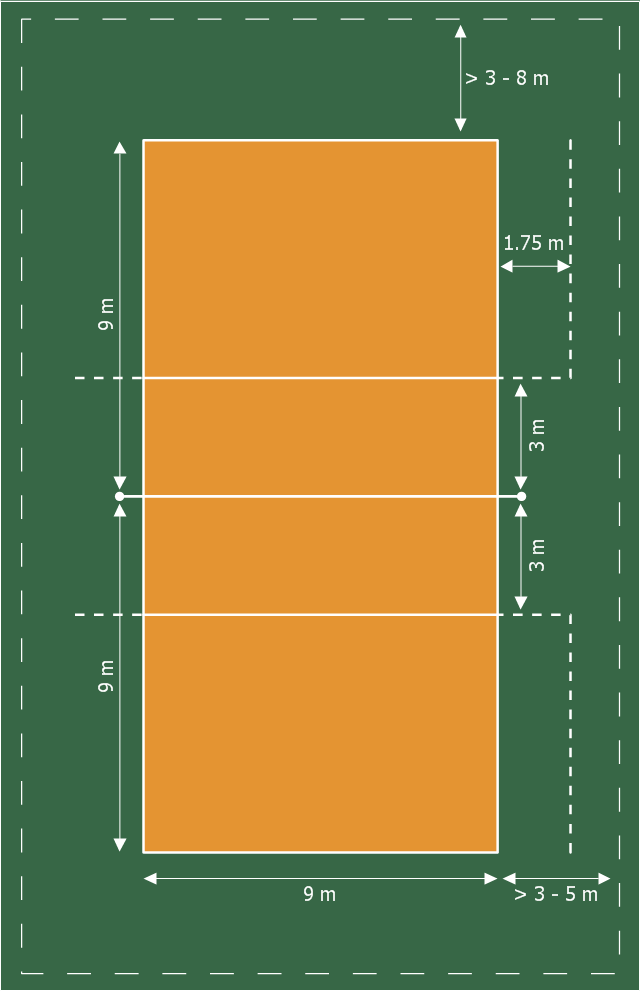
"Volleyball is a team sport in which two teams of six players are separated by a net. Each team tries to score points by grounding a ball on the other team's court under organized rules. It has been a part of the official program of the Summer Olympic Games since 1964. ...
The court dimensions.
A volleyball court is 18 m (59 ft) long and 9 m (29.5 ft) wide, divided into 9 m × 9 m halves by a one-meter (40-inch) wide net. The top of the net is 2.43 m (8 ft 0 in) above the center of the court for men's competition, and 2.24 m (7 ft 4 in) for women's competition, varied for veterans and junior competitions.
The minimum height clearance for indoor volleyball courts is 7 m (23 ft), although a clearance of 8 m (26 ft) is recommended.
A line 3 m (9.84 ft) from and parallel to the net is considered the "attack line". This "3 meter" (or "10-foot") line divides the court into "back row" and "front row" areas (also back court and front court). These are in turn divided into 3 areas each: these are numbered as follows, starting from area "1", which is the position of the serving player.
After a team gains the serve (also known as siding out), its members must rotate in a clockwise direction, with the player previously in area "2" moving to area "1" and so on, with the player from area "1" moving to area "6".
The team courts are surrounded by an area called the free zone which is a minimum of 3 meters wide and which the players may enter and play within after the service of the ball. All lines denoting the boundaries of the team court and the attack zone are drawn or painted within the dimensions of the area and are therefore a part of the court or zone. If a ball comes in contact with the line, the ball is considered to be "in". An antenna is placed on each side of the net perpendicular to the sideline and is a vertical extension of the side boundary of the court. A ball passing over the net must pass completely between the antennae (or their theoretical extensions to the ceiling) without contacting them." [Volleyball. Wikipedia]
The sport field plan example "Volleyball court dimensions" was created using the ConceptDraw PRO diagramming and vector drawing software extended with the Sport Field Plans solution from the Building Plans area of ConceptDraw Solution Park.
This file is licensed under the Creative Commons Attribution-Share Alike 3.0 Unported license. [creativecommons.org/ licenses/ by-sa/ 3.0/ deed.en]
"Volleyball is a team sport in which two teams of six players are separated by a net. Each team tries to score points by grounding a ball on the other team's court under organized rules. It has been a part of the official program of the Summer Olympic Games since 1964. ...
The court dimensions.
A volleyball court is 18 m (59 ft) long and 9 m (29.5 ft) wide, divided into 9 m × 9 m halves by a one-meter (40-inch) wide net. The top of the net is 2.43 m (8 ft 0 in) above the center of the court for men's competition, and 2.24 m (7 ft 4 in) for women's competition, varied for veterans and junior competitions.
The minimum height clearance for indoor volleyball courts is 7 m (23 ft), although a clearance of 8 m (26 ft) is recommended.
A line 3 m (9.84 ft) from and parallel to the net is considered the "attack line". This "3 meter" (or "10-foot") line divides the court into "back row" and "front row" areas (also back court and front court). These are in turn divided into 3 areas each: these are numbered as follows, starting from area "1", which is the position of the serving player.
After a team gains the serve (also known as siding out), its members must rotate in a clockwise direction, with the player previously in area "2" moving to area "1" and so on, with the player from area "1" moving to area "6".
The team courts are surrounded by an area called the free zone which is a minimum of 3 meters wide and which the players may enter and play within after the service of the ball. All lines denoting the boundaries of the team court and the attack zone are drawn or painted within the dimensions of the area and are therefore a part of the court or zone. If a ball comes in contact with the line, the ball is considered to be "in". An antenna is placed on each side of the net perpendicular to the sideline and is a vertical extension of the side boundary of the court. A ball passing over the net must pass completely between the antennae (or their theoretical extensions to the ceiling) without contacting them." [Volleyball. Wikipedia]
The sport field plan example "Volleyball court dimensions" was created using the ConceptDraw PRO diagramming and vector drawing software extended with the Sport Field Plans solution from the Building Plans area of ConceptDraw Solution Park.
Sport field plan
The vector stencils library "American football positions" contains 38 symbols for drawing diagrams of American football positions.
"In American football, each team has eleven players on the field at one time. The specific role that a player takes on the field is called their position. Under the modern rules of American football, teams are allowed unlimited substitutions, that is teams may change any number of players after any play. This has resulted in the development of three "platoons" of players, the offense (the team with the ball, who is trying to score), the defense (the team trying to prevent the other team from scoring, and to take the ball from them), and the special teams (who play in kicking situations). Within those platoons, various specific positions exist depending on what the player's main job is." [American football positions. Wikipedia]
The symbols example "Design elements - Football positions (for perspective view)" was created using the ConceptDraw PRO diagramming and vector drawing software extended with the Football solution from the Sport area of ConceptDraw Solution Park.
American football positions diagram symbols
.png--diagram-flowchart-example.png)
Making a Histogram

- Football Scoreboard Icon Png
- Soccer pictograms - Vector stencils library | Footballer Black Icon Png
- Referee Png Icon
- Percent Png
- Champion Icon
- Goalkeeper Icon Png
- Goalkeeper Png
- Goal Score Png
- Goal Keeper Png
- Soccer (Football) Formation | Soccer | Champion Cup In Png
- Football Elements Png
- Football Referee Shirts Png
- Goalkeeper Vector Png Hd
- Achievement Png
- Soccer Player Profile Icon Png
- Object Clipart Pictogram Png
- Hiring Png
- Step By Step Achievement Vector Png
- Football Vector Png
- Winter Icon Png
- ERD | Entity Relationship Diagrams, ERD Software for Mac and Win
- Flowchart | Basic Flowchart Symbols and Meaning
- Flowchart | Flowchart Design - Symbols, Shapes, Stencils and Icons
- Flowchart | Flow Chart Symbols
- Electrical | Electrical Drawing - Wiring and Circuits Schematics
- Flowchart | Common Flowchart Symbols
- Flowchart | Common Flowchart Symbols