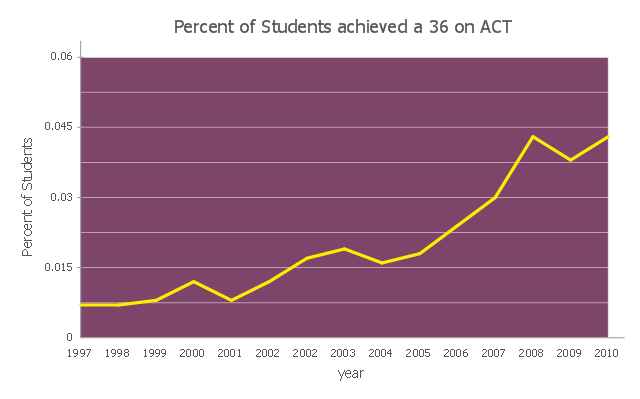
This line graph sample shows the percent of students achieved a 36 on ACT from 1997 to 2011. It was designed on the base of the Wikimedia Commons file: ACT-36-1997 to 2011.png.
[commons.wikimedia.org/ wiki/ File:ACT-36-1997_ to_ 2011.png]
This file is licensed under the Creative Commons Attribution-Share Alike 3.0 Unported license.
[creativecommons.org/ licenses/ by-sa/ 3.0/ deed.en]
"The ACT (... American College Testing) college readiness assessment is a standardized test for high school achievement and college admissions in the United States produced by ACT, Inc. It was first administered in November 1959 by Everett Franklin Lindquist as a competitor to the College Board's Scholastic Aptitude Test, now the SAT Reasoning Test. The ACT originally consisted of four tests: English, Mathematics, Social Studies, and Natural Sciences. In 1989, the Social Studies test was changed into a Reading section (which included a Social Studies subsection) and the Natural Sciences test was renamed the Science Reasoning test, with more emphasis on problem solving skills. In February 2005, an optional Writing test was added to the ACT... In the Spring of 2015, the ACT will start to be offered as a computer-based test that will incorporate some optional Constructed Response Questions; the test content, composite score and multiple choice format will not be affected by these changes. ...
All four-year colleges and universities in the U.S. accept the ACT, but different institutions place different emphases on standardized tests such as the ACT, compared to other factors of evaluation such as class rank, GPA, and extracurricular activities. The main four tests are scored individually on a scale of 1–36, and a Composite score is provided which is the whole number average of the four scores." [ACT (test). Wikipedia]
The line chart example "Percent of students achieved a 36 on ACT" was created using the ConceptDraw PRO diagramming and vector drawing software extended with the Line Graphs solution from the Graphs and Charts area of ConceptDraw Solution Park.
Line chart
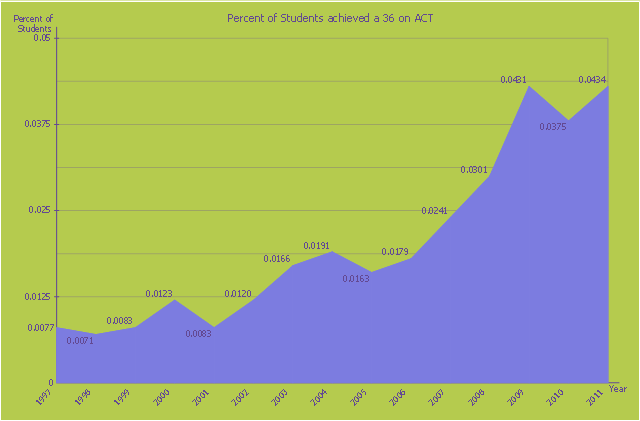
This area chart sample shows the percent of students achieved a 36 on ACT from 1997 to 2011. It was designed on the base of the Wikimedia Commons file: ACT-36-1997 to 2011.png. [commons.wikimedia.org/ wiki/ File:ACT-36-1997_ to_ 2011.png]
This file is licensed under the Creative Commons Attribution-Share Alike 3.0 Unported license. [creativecommons.org/ licenses/ by-sa/ 3.0/ deed.en]
"The ACT (originally an abbreviation of American College Testing) college readiness assessment is a standardized test for high school achievement and college admissions in the United States produced by ACT, Inc. ...
The required portion of the ACT is divided into four multiple choice subject tests: English, mathematics, reading, and science reasoning. Subject test scores range from 1 to 36; all scores are integers. The English, mathematics, and reading tests also have subscores ranging from 1 to 18. (The subject score is not the sum of the subscores.) The composite score is the average of all four tests. In addition, students taking the optional writing test receive a writing score ranging from 1 to 36 (This is a change from the previous 2–12 score range). The writing score does not affect the composite score." [ACT (test). Wikipedia]
The area graph example "Persent of Students achieved a 36 on ACT" was created using the ConceptDraw PRO diagramming and vector drawing software extended with the Area Charts solution from the Graphs and Charts area of ConceptDraw Solution Park.
Area chart
 Pie Charts
Pie Charts are extensively used in statistics and business for explaining data and work results, in mass media for comparison (i.e. to visualize the percentage for the parts of one total), and in many other fields. The Pie Charts solution for ConceptDraw PRO v10 offers powerful drawing tools, varied templates, samples, and a library of vector stencils for simple construction and design of Pie Charts, Donut Chart, and Pie Graph Worksheets.
 Health Food
The Health Food solution contains the set of professionally designed samples and large collection of vector graphic libraries of healthy foods symbols of fruits, vegetables, herbs, nuts, beans, seafood, meat, dairy foods, drinks, which give powerful possi
Product Overview

Chart Templates

Chart Examples

HelpDesk
How to Draw the Different Types of Pie Charts
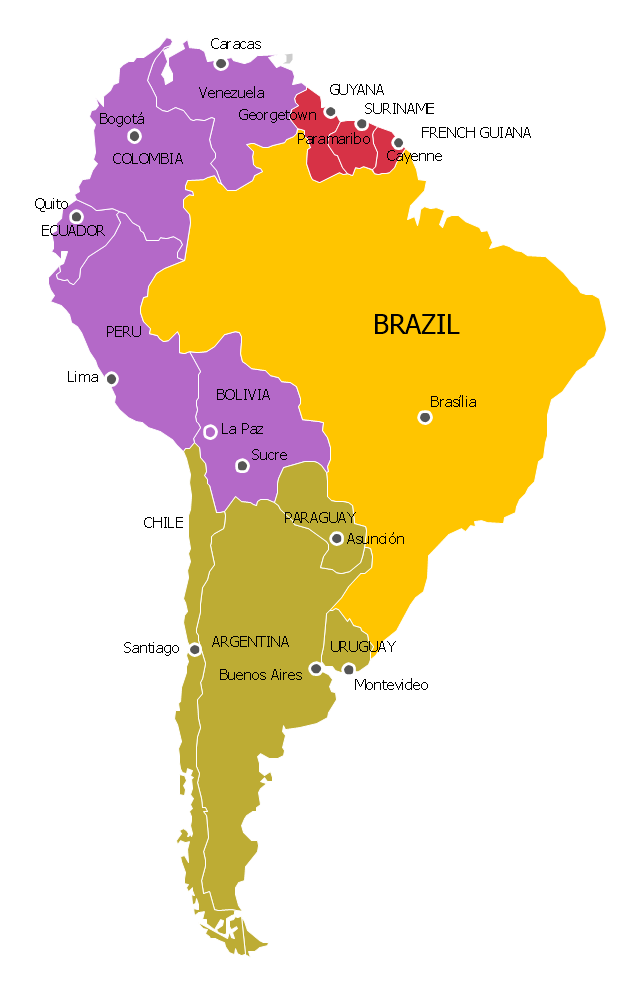
"The Andean States are a group of nations in South America that are defined by sharing a common geography (Andes mountain range) or culture such as the Quechua language and Andean cuisine which was primarily spread during the times of the Inca Empire, but also before and after it.
Politically speaking, Argentina and Chile are usually not considered part of the Andean States as they lack a strong native Andean heritage and are culturally more oriented towards Europe and they are not a members of the Andean Community of Nations (which Venezuela is in the process of leaving).
The Andes occupy the western part of South America, stretching through the following countries: Colombia, Venezuela, Ecuador, Peru, Bolivia, Argentina (not considered to be -geopolitically- an Andean State), Chile (not considered to be -geopolitically- an Andean State)." [Andean states. Wikipedia]
"Southern Cone (Spanish: Cono Sur, Portuguese: Cone Sul) is a geographic region composed of the southernmost areas of South America, south of and around the Tropic of Capricorn. Traditionally, it covers Argentina, Chile and Uruguay, bounded on the west by the Pacific Ocean, and south to the junction between the Pacific and Atlantic Oceans, which is the closest continental area of Antarctica (1000 km). In terms of social and political geography, the Southern Cone comprises Argentina, Chile, Paraguay, Uruguay, Southern Brazil and the Brazilian state of São Paulo.
High life expectancy, the highest Human Development Index of Latin America, high standard of living, significant participation in the global markets and the emerging economy of its members make the Southern Cone the most prosperous macro-region in South America." [Southern Cone. Wikipedia]
Eastern South America (Brazil). "Brazil Listeni/ brəˈzɪl/ (Portuguese: Brasil, IPA: [bɾaˈziw]), officially the Federative Republic of Brazil (Portuguese: República Federativa do Brasil, About this sound listen (help·info)), is the largest country in both South America and the Latin American region. It is the world's fifth largest country, both by geographical area and by population. It is the largest Portuguese-speaking country in the world, and the only one in the Americas. Bounded by the Atlantic Ocean on the east, Brazil has a coastline of 7,491 km (4,655 mi). It is bordered on the north by Venezuela, Guyana, Suriname and the French overseas region of French Guiana; on the northwest by Colombia; on the west by Bolivia and Peru; on the southwest by Argentina and Paraguay and on the south by Uruguay. Numerous archipelagos form part of Brazilian territory, such as Fernando de Noronha, Rocas Atoll, Saint Peter and Paul Rocks, and Trindade and Martim Vaz. It borders all other South American countries except Ecuador and Chile and occupies 47 percent of the continent of South America." [Brazil. Wikipedia]
"The Guianas, sometimes called by the Spanish loan-word Guayanas (Las Guayanas) refers to a region in north-eastern South America which includes the following three territories:
(1) French Guiana, an overseas department of France,
(2) Guyana, known as British Guiana from 1831 until 1966, after the colonies of Berbice, Essequibo, and Demerara, taken from the Netherlands in 1814, were merged into a single colony,
(3) Suriname, until 1814 a part of Dutch Guiana, together with Berbice, Essequibo and Demerara." [The Guianas. Wikipedia]
This political map sample was redesigned from the Wikimedia Commons file: South America Color-coded Regions.png. [commons.wikimedia.org/ wiki/ File:South_ America_ Color-coded_ Regions.png]
This file is licensed under the Creative Commons Attribution-Share Alike 3.0 Unported license. [creativecommons.org/ licenses/ by-sa/ 3.0/ deed.en]
The example "South America regions - Political map" was created using the ConceptDraw PRO diagramming and vector drawing software extended with the Continent Maps solution from the Maps area of ConceptDraw Solution Park.
Political map - South America regions
Percentage Pie Chart. Pie Chart Examples

HelpDesk
What Information can be Displayed in the Multiproject Dashboard View


This line chart sample depicts data from the European Economic Forecast (EUROPEAN ECONOMY 1|2013, Economic and Financial Affairs Winter 2013, European Commission).
[ec.europa.eu/ economy_ finance/ publications/ european_ economy/ 2013/ pdf/ ee1_ en.pdf]
"Exports in France decreased to 36526 EUR Million in October of 2013 from 36637 EUR Million in September of 2013. Exports in France is reported by the Ministère de l'Économie et des Finances. Exports in France averaged 17102.29 EUR Million from 1970 until 2013, reaching an all time high of 37964 EUR Million in August of 2012 and a record low of 1165.60 EUR Million in May of 1970. France is one of the largest exporters of luxury goods and agricultural products in the world. France main exports are: aircrafts (10.1 percent of total exports), food (9.7 percent), chemicals (9.5 percent), industrial machinery (8.3 percent), iron and steel (7.9 percent), electronics (6.7 percent), motor vehicles (6.3 percent) and pharmaceuticals (6.1 percent). Trade outflows to Europe account for 70 percent of total exports. Main export partners are: Germany (16.6 percent of total exports), Italy (8.2 percent), Spain (7.3 percent), Belgium (7.2 percent), the United Kingdom (6.6 percent), the United States (5.6 percent), Netherlands and China. This page contains - France Exports - actual values, historical data, forecast, chart, statistics, economic calendar and news." [tradingeconomics.com/ france/ exports]
The line graph example "France exports of goods and services" was created using ConceptDraw PRO diagramming and vector drawing software extended with Line Graphs solution from Graphs and Charts area of ConceptDraw Solution Park.
Line chart

Managing the task list

This example was created on the base of thematic map "Germany: Sugarbeets. Percent of total area by state" from the website of the U.S. Department of Agriculture. [usda.gov/ oce/ weather/ pubs/ Other/ MWCACP/ Graphs/ eur/ grmsugb.gif]
"Sugar beet, cultivated Beta vulgaris, is a plant whose root contains a high concentration of sucrose. It is grown commercially for sugar production.
In 2011, France, the United States, Germany, Russia, and Ukraine were the world's five largest sugar beet producers by mass, whilst by value Turkey takes the place of Ukraine. However, in 2010–2011, North America, Western Europe, and Eastern Europe did not produce enough sugar from sugar beets to meet overall demand for sugar, and were all net importers of sugar. ... In 2009, sugar beets accounted for 20% of the world's sugar production." [Sugar beet. Wikipedia]
The thematic map example "Germany crop areas map - Sugar beets" was designed using the ConceptDraw PRO software extended with the Map of Germany solution from the Maps area of ConceptDraw Solution Park.
Germany thematic map example

Line Chart Template for Word

- Percentage Chart Png
- Icon App De Camera Png
- Pie Charts | Percentage Png
- Cono Sur Png
- Chile Icon Png Territory
- College Student Vector Png
- Charts And Graphs Png
- Percent of Students achieved a 36 on ACT | Professions - Vector ...
- Achievement Png
- Mountain Range Vector Png
- Apps De Iphone Png
- American South Png
- Latin America - Vector stencils library | Flags - Stencils library ...
- High Mountains Vector Png
- Global Market Vector Png
- Score Icon Png
- Solving Mathematic Png
- Donut Chart Icon Png
- Percent of Students achieved a 36 on ACT | Percentage of U.S. high ...