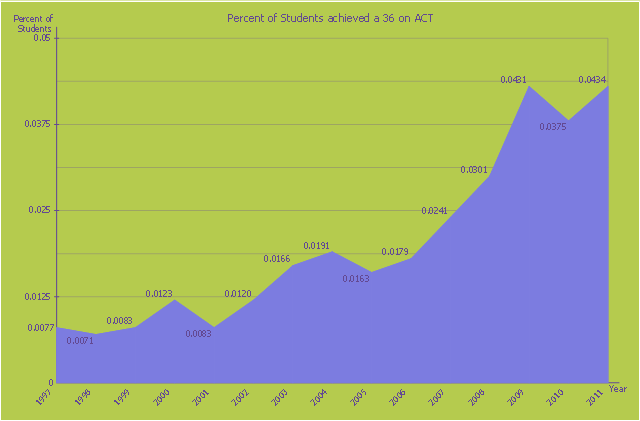
This area chart sample shows the percent of students achieved a 36 on ACT from 1997 to 2011. It was designed on the base of the Wikimedia Commons file: ACT-36-1997 to 2011.png. [commons.wikimedia.org/ wiki/ File:ACT-36-1997_ to_ 2011.png]
This file is licensed under the Creative Commons Attribution-Share Alike 3.0 Unported license. [creativecommons.org/ licenses/ by-sa/ 3.0/ deed.en]
"The ACT (originally an abbreviation of American College Testing) college readiness assessment is a standardized test for high school achievement and college admissions in the United States produced by ACT, Inc. ...
The required portion of the ACT is divided into four multiple choice subject tests: English, mathematics, reading, and science reasoning. Subject test scores range from 1 to 36; all scores are integers. The English, mathematics, and reading tests also have subscores ranging from 1 to 18. (The subject score is not the sum of the subscores.) The composite score is the average of all four tests. In addition, students taking the optional writing test receive a writing score ranging from 1 to 36 (This is a change from the previous 2–12 score range). The writing score does not affect the composite score." [ACT (test). Wikipedia]
The area graph example "Persent of Students achieved a 36 on ACT" was created using the ConceptDraw PRO diagramming and vector drawing software extended with the Area Charts solution from the Graphs and Charts area of ConceptDraw Solution Park.
Area chart
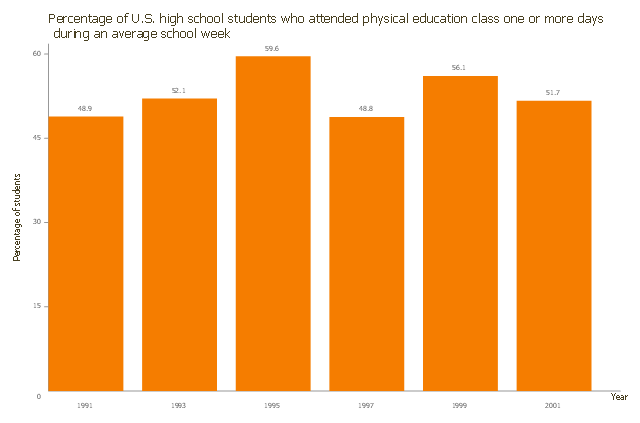
This vertical bar chart sample shows the percentage of U.S. high school students. It was designed on the base of the bar graph from the article "Childhood Obesity — What We Can Learn From Existing Data on Societal Trends, Part 2" on the U.S. Centers for Disease Control and Prevention (CDC) website.
[cdc.gov/ pcd/ issues/ 2005/ apr/ 04_ 0039.htm]
"Childhood obesity is a condition where excess body fat negatively affects a child's health or well-being. As methods to determine body fat directly are difficult, the diagnosis of obesity is often based on BMI. Due to the rising prevalence of obesity in children and its many adverse health effects it is being recognized as a serious public health concern." [Childhood obesity. Wikipedia]
The column chart example "Percentage of U.S. high school students" was created using the ConceptDraw PRO diagramming and vector drawing software extended with the Bar Graphs solution from the Graphs and Charts area of ConceptDraw Solution Park.
Column chart
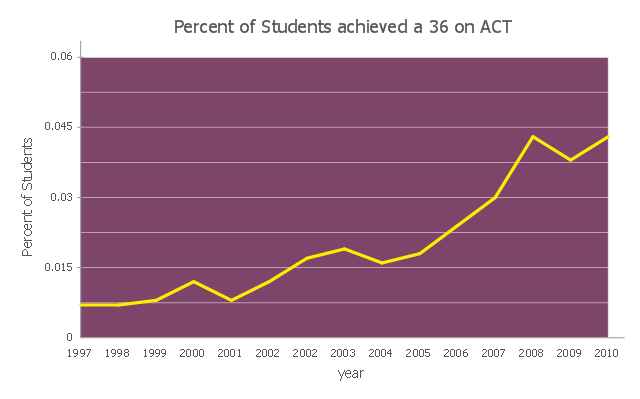
This line graph sample shows the percent of students achieved a 36 on ACT from 1997 to 2011. It was designed on the base of the Wikimedia Commons file: ACT-36-1997 to 2011.png.
[commons.wikimedia.org/ wiki/ File:ACT-36-1997_ to_ 2011.png]
This file is licensed under the Creative Commons Attribution-Share Alike 3.0 Unported license.
[creativecommons.org/ licenses/ by-sa/ 3.0/ deed.en]
"The ACT (... American College Testing) college readiness assessment is a standardized test for high school achievement and college admissions in the United States produced by ACT, Inc. It was first administered in November 1959 by Everett Franklin Lindquist as a competitor to the College Board's Scholastic Aptitude Test, now the SAT Reasoning Test. The ACT originally consisted of four tests: English, Mathematics, Social Studies, and Natural Sciences. In 1989, the Social Studies test was changed into a Reading section (which included a Social Studies subsection) and the Natural Sciences test was renamed the Science Reasoning test, with more emphasis on problem solving skills. In February 2005, an optional Writing test was added to the ACT... In the Spring of 2015, the ACT will start to be offered as a computer-based test that will incorporate some optional Constructed Response Questions; the test content, composite score and multiple choice format will not be affected by these changes. ...
All four-year colleges and universities in the U.S. accept the ACT, but different institutions place different emphases on standardized tests such as the ACT, compared to other factors of evaluation such as class rank, GPA, and extracurricular activities. The main four tests are scored individually on a scale of 1–36, and a Composite score is provided which is the whole number average of the four scores." [ACT (test). Wikipedia]
The line chart example "Percent of students achieved a 36 on ACT" was created using the ConceptDraw PRO diagramming and vector drawing software extended with the Line Graphs solution from the Graphs and Charts area of ConceptDraw Solution Park.
Line chart
 Education
This solution extends ConceptDraw PRO and ConceptDraw MINDMAP with specific content that helps illustrate educational documents, presentations, and websites quickly and easily with astronomy, chemistry, math and physics vector pictures and clip art.
This example is based on the organizational chart from the Ohio State University website. [osu.edu/ vpsearch/ images/ University_ Org_ Chart.png]
"The Ohio State University, a multi-campus land grant institution with an international presence, is a world-class public research university and the leading comprehensive teaching and research institution in the state, Ohio's flagship university. Ohio State provides a distinctive educational experience for students and pursues cutting-edge interdisciplinary research that brings together scholars from diverse disciplines to solve key problems in society.
One of the University's core values is to "ignite a lifelong love of learning" in students. Ohio State students benefit from a scholarly environment in which research inspires and informs teaching.
The Vice President for Student Life provides vision, leadership, and strategic direction to the Office of Student Life, a comprehensive unit dedicated to supporting the educational mission of the University and promoting the best possible overall experience for the diverse student body of approximately 60,000. The Office of Student Life supports every aspect of Ohio State students experience. Its scope includes housing, campus dining, disability services, the multicultural center, counseling and health services, student organizations and leadership development, and other related operations." [osu.edu/ vpsearch/ ]
The organizational chart example "University leadership" was created using the ConceptDraw PRO diagramming and vector drawing software extended with the Organizational Charts solution from the Management area of ConceptDraw Solution Park.
Organizational chart - University leadership

Applications

- Samples Of Students Swot Analysis
- Personal Swot Analysis Examples For Students
- Swot Analysis For Engineering Students Examples
- Teaching Students To Draw Diagrams In Biology
- Line Graph Examples For Students
- A Students Time Table By Pie Chirt
- Swot For Students
- Swot Analysis Examples For Students Performance
- Percent of Students achieved a 36 on ACT | Percentage of the top 1 ...
- Students And Teacher Relationship Clipart
- Percent of Students achieved a 36 on ACT | South America regions ...
- Quality Mind Map | Ourself Of Swot Analysis Examples For Electrical ...
- Students And Teachers Er
- Teacher And Student Schedule Erd
- Swot Analysis On Yourself Example For University Students
- LLNL Flow Charts | Threats Of Engineering Students
- Swot Analysis Ppt For Students
- Basic Diagramming | Venn diagrams with ConceptDraw PRO | Line ...
- Think and act effectively | Percent of students achieved a 36 on ACT ...