Basic Diagramming


Venn Diagram

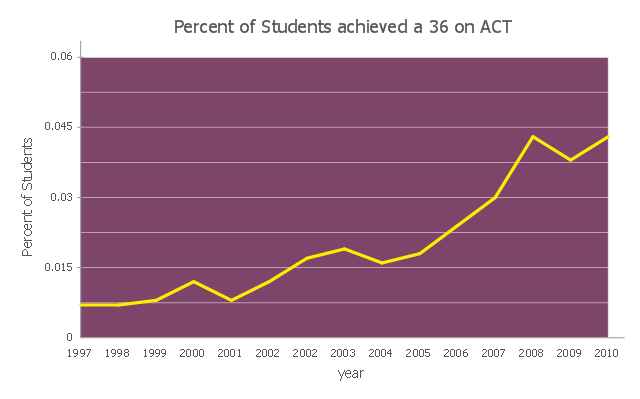
This line graph sample shows the percent of students achieved a 36 on ACT from 1997 to 2011. It was designed on the base of the Wikimedia Commons file: ACT-36-1997 to 2011.png.
[commons.wikimedia.org/ wiki/ File:ACT-36-1997_ to_ 2011.png]
This file is licensed under the Creative Commons Attribution-Share Alike 3.0 Unported license.
[creativecommons.org/ licenses/ by-sa/ 3.0/ deed.en]
"The ACT (... American College Testing) college readiness assessment is a standardized test for high school achievement and college admissions in the United States produced by ACT, Inc. It was first administered in November 1959 by Everett Franklin Lindquist as a competitor to the College Board's Scholastic Aptitude Test, now the SAT Reasoning Test. The ACT originally consisted of four tests: English, Mathematics, Social Studies, and Natural Sciences. In 1989, the Social Studies test was changed into a Reading section (which included a Social Studies subsection) and the Natural Sciences test was renamed the Science Reasoning test, with more emphasis on problem solving skills. In February 2005, an optional Writing test was added to the ACT... In the Spring of 2015, the ACT will start to be offered as a computer-based test that will incorporate some optional Constructed Response Questions; the test content, composite score and multiple choice format will not be affected by these changes. ...
All four-year colleges and universities in the U.S. accept the ACT, but different institutions place different emphases on standardized tests such as the ACT, compared to other factors of evaluation such as class rank, GPA, and extracurricular activities. The main four tests are scored individually on a scale of 1–36, and a Composite score is provided which is the whole number average of the four scores." [ACT (test). Wikipedia]
The line chart example "Percent of students achieved a 36 on ACT" was created using the ConceptDraw PRO diagramming and vector drawing software extended with the Line Graphs solution from the Graphs and Charts area of ConceptDraw Solution Park.
Line chart
- Basic Diagramming | Mathematics | Venn diagrams with ...
- Mathematics | Astronomy | Science and Education Area |
- Math illustration template | Mathematics | Venn diagrams with ...
- Applications | Science and Education Area | Mathematics |
- Physics | Language Learning | Astronomy |
- 5-Set Venn diagram template
- Chemistry | Mathematics | Physics |
- Physics | Education | Mathematical pendulum diagram |
- eLearning for Skype | Business Diagram Software | Skype as ...
- Basic Flowchart Examples | Flowchart Software | Flow Chart ...
- Basic Diagramming | Arrow circle chart template | How to Draw a ...
- Pie Chart Examples | Pie Chart Software | How to Create a Pie Chart |
- ConceptDraw Arrows10 Technology | eLearning for Skype | Cross ...
- Basic Diagramming | Types of Flowchart - Overview | Basic ...
- Quality Mind Maps - samples and templates | Entity Relationship ...
- Venn diagrams with ConceptDraw PRO | Venn Diagrams | Venn ...
- Example Process Flow | Example of Flowchart Diagram | Flow Chart ...
- Basic Diagramming | Education | The Best Drawing Program for Mac |
- Scatter Chart Examples | Line Chart Examples | Correlation ...
- Venn diagrams with ConceptDraw PRO | Venn Diagrams | Best ...