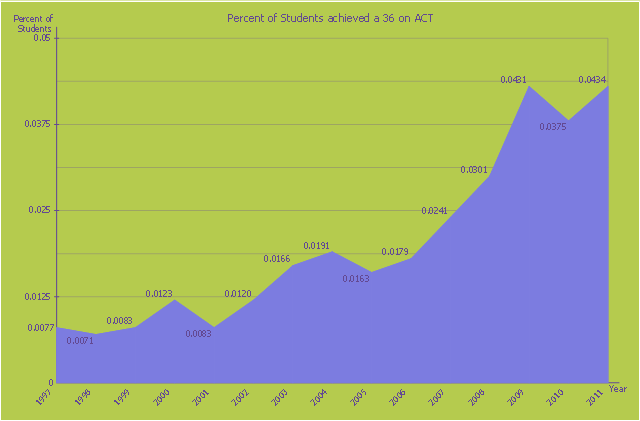
This area chart sample shows the percent of students achieved a 36 on ACT from 1997 to 2011. It was designed on the base of the Wikimedia Commons file: ACT-36-1997 to 2011.png. [commons.wikimedia.org/ wiki/ File:ACT-36-1997_ to_ 2011.png]
This file is licensed under the Creative Commons Attribution-Share Alike 3.0 Unported license. [creativecommons.org/ licenses/ by-sa/ 3.0/ deed.en]
"The ACT (originally an abbreviation of American College Testing) college readiness assessment is a standardized test for high school achievement and college admissions in the United States produced by ACT, Inc. ...
The required portion of the ACT is divided into four multiple choice subject tests: English, mathematics, reading, and science reasoning. Subject test scores range from 1 to 36; all scores are integers. The English, mathematics, and reading tests also have subscores ranging from 1 to 18. (The subject score is not the sum of the subscores.) The composite score is the average of all four tests. In addition, students taking the optional writing test receive a writing score ranging from 1 to 36 (This is a change from the previous 2–12 score range). The writing score does not affect the composite score." [ACT (test). Wikipedia]
The area graph example "Persent of Students achieved a 36 on ACT" was created using the ConceptDraw PRO diagramming and vector drawing software extended with the Area Charts solution from the Graphs and Charts area of ConceptDraw Solution Park.
Area chart
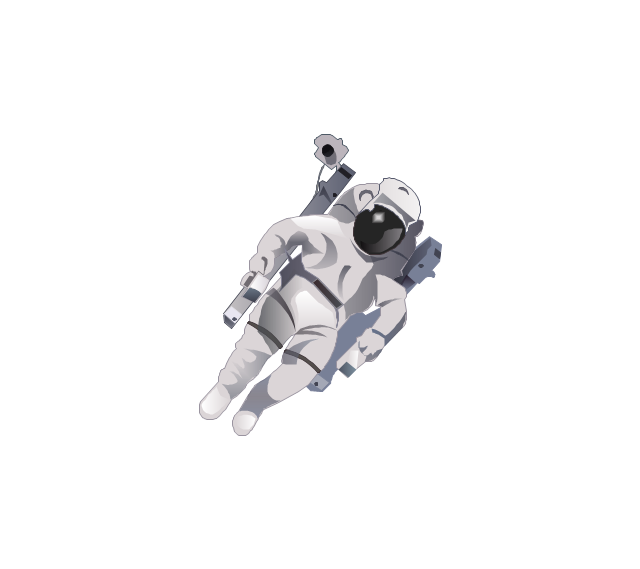
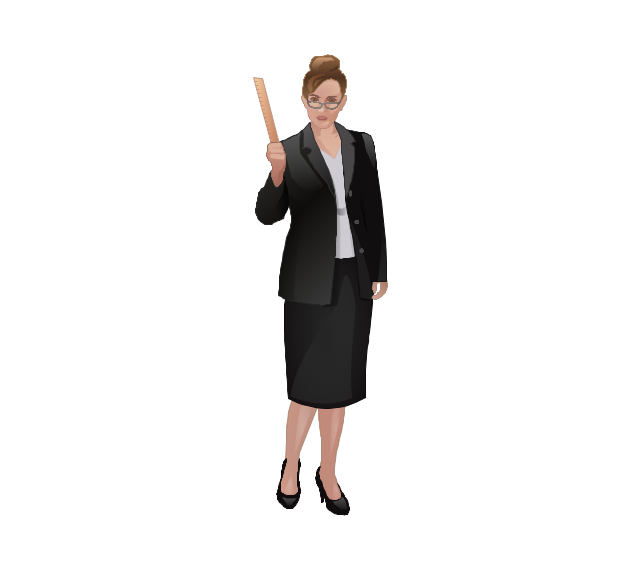
The vector stencils library "Professions" contains 58 people clipart images of different professions you can use in your presentations, illustrations and infographics.
"Electronic clip art is available in several different file formats. It is important for clip art users to understand the differences between file formats so that they can use an appropriate image file and get the resolution and detail results they need.
Clip art file formats are divided into 2 different types: bitmap or vector graphics. ...
In contrast to the grid format of bitmap images, Vector graphics file formats use geometric modeling to describe an image as a series of points, lines, curves, and polygons. Because the image is described using geometric data instead of fixed pixels, the image can be scaled to any size while retaining "resolution independence", meaning that the image can be printed at the highest resolution a printer supports, resulting in a clear, crisp image. Vector file formats are usually superior in resolution and ease of editing as compared to bitmap file formats, but are not as widely supported by software and are not well-suited for storing pixel-specific data such as scanned photographs. In the early years of electronic clip art, vector illustrations were limited to simple line art representations." [Clip art. Wikipedia]
The clip art example "Professions - Vector stencils library" was created using the ConceptDraw PRO diagramming and vector drawing software extended with the People solution from the Illustration area of ConceptDraw Solution Park.
www.conceptdraw.com/ solution-park/ illustrations-people
Builder 1

System administrator

Worker of conveyor

Clerk 1

Clerk 2

Student 2

Student 3

Student 1

Dispatcher 1

Accountant

Gardener

Lawyer

Jurist
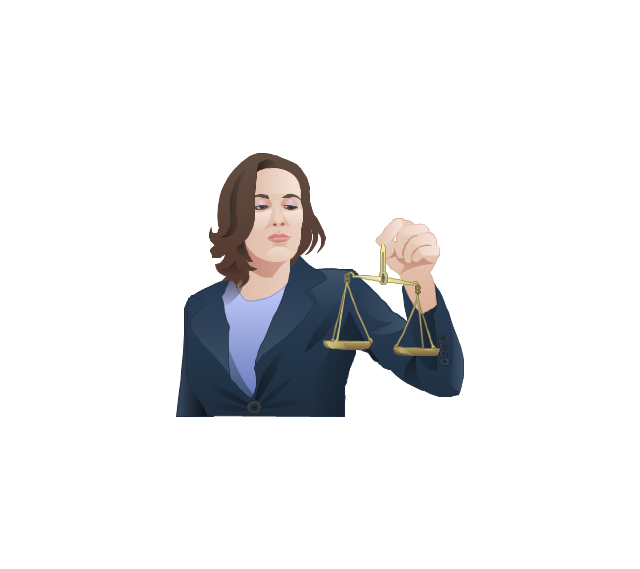
Judge

Consultant

Manager

Director

Programmer

Architect

Pilot

Policeman

Secretary

Security officer

Clerk 3

Musician

Presenter

Athlete

Artist

Announcer

Photographer

Hairdresser

Florist

Spaceman
Engineer

Reporter

Tailor

Dispatcher 2

Biologist

Chemist

Dentist

Priest

Soldier

Doctor

Driver

Carpenter

Fireman

Seaman

Builder 2

Postman

Miner

Waiter

Cleaner

Cashier

Shop assistant

Cook

Flight attendant

Teacher
Hall porter

DroidDia PRO unlocker
.jpg "droiddia pro unlocker")
This example is based on the organizational chart from the Ohio State University website. [osu.edu/ vpsearch/ images/ University_ Org_ Chart.png]
"The Ohio State University, a multi-campus land grant institution with an international presence, is a world-class public research university and the leading comprehensive teaching and research institution in the state, Ohio's flagship university. Ohio State provides a distinctive educational experience for students and pursues cutting-edge interdisciplinary research that brings together scholars from diverse disciplines to solve key problems in society.
One of the University's core values is to "ignite a lifelong love of learning" in students. Ohio State students benefit from a scholarly environment in which research inspires and informs teaching.
The Vice President for Student Life provides vision, leadership, and strategic direction to the Office of Student Life, a comprehensive unit dedicated to supporting the educational mission of the University and promoting the best possible overall experience for the diverse student body of approximately 60,000. The Office of Student Life supports every aspect of Ohio State students experience. Its scope includes housing, campus dining, disability services, the multicultural center, counseling and health services, student organizations and leadership development, and other related operations." [osu.edu/ vpsearch/ ]
The organizational chart example "University leadership" was created using the ConceptDraw PRO diagramming and vector drawing software extended with the Organizational Charts solution from the Management area of ConceptDraw Solution Park.
Organizational chart - University leadership

 Entity-Relationship Diagram (ERD)
Entity-Relationship Diagram (ERD) solution extends ConceptDraw PRO software with templates, samples and libraries of vector stencils from drawing the ER-diagrams by Chen's and crow’s foot notations.
 School and Training Plans
Planning a school and its campus layout needs to depict the premises, represent internal spaces, location of windows and direction of natural light. Detailed classroom seating chart helps you visualize location of the blackboard and desks, taking into account the specifics of the room and its lighting, with a goal to design the classroom to be comfortable for each pupil and teacher.
 Bar Graphs
The Bar Graphs solution enhances ConceptDraw PRO v10 functionality with templates, numerous professional-looking samples, and a library of vector stencils for drawing different types of Bar Graphs, such as Simple Bar Graph, Double Bar Graph, Divided Bar Graph, Horizontal Bar Graph, Vertical Bar Graph, and Column Bar Chart.
HelpDesk
How to Purchase ConceptDraw Products for Academic/Nonprofit Institutions

- Indian Student Png
- Professions - Vector stencils library | Student Girl Clip Art Png
- Leadership Png
- School layout - Vector stencils library | Desk Aerial View Png Drawing
- Students Clipart Png
- Png Picture Of Student In The Classroom Drawing
- Teacher Png Image
- Student Cartoons Png
- Worker Clipart Png
- Programmer Logo Png
- картинки Png
- Table Png Aerial
- Student Animation Png
- Png School Double Classrooms Plan
- Programmer Png
- Executive Driver Vector Png
- Vector Png Images
- School Illustration Png
- Meal Icon Png
- Percent of Students achieved a 36 on ACT | Percent of students ...