Bar Diagrams for Problem Solving. Create economics and financial bar charts with Bar Graphs Solution

Process Flowchart


 Pie Charts
Pie Charts are extensively used in statistics and business for explaining data and work results, in mass media for comparison (i.e. to visualize the percentage for the parts of one total), and in many other fields. The Pie Charts solution for ConceptDraw PRO v10 offers powerful drawing tools, varied templates, samples, and a library of vector stencils for simple construction and design of Pie Charts, Donut Chart, and Pie Graph Worksheets.
How to Create Presentation of Your Project Gantt Chart

The 3D vertical bar graph sample shows the Iran internet users per 100 person from 2000 to 2011. It was designed on the base of the Commons Wikimedia file: Iran internet users per 100 person.png.
[commons.wikimedia.org/ wiki/ File:Iran_ internet_ users_ per_ 100_ person.png]
This file is licensed under the Creative Commons Attribution-Share Alike 3.0 Unported license. [creativecommons.org/ licenses/ by-sa/ 3.0/ deed.en]
The data source is World Bank: [data.worldbank.org/ country/ iran-islamic-republic]
"In 1993 Iran became the second country in the Middle East to be connected to the Internet, and since then the government has made significant efforts to improve the nation's ICT infrastructure. Iran's national Internet connectivity infrastructure is based on two major networks: the public switched telephone network (PSTN) and the public data network. The PSTN provides a connection for end-users to Internet service providers (ISPs) over mostly digital lines and supports modem-based connections. The Data Communication Company of Iran (DCI), a subsidiary of TCI, operates the public data network." [Internet in Iran. Wikipedia]
The 3D column chart example "Iran internet users per 100 person" was created using the ConceptDraw PRO diagramming and vector drawing software extended with the Bar Graphs solution from the Graphs and Charts area of ConceptDraw Solution Park.
3D Column chart

Bar Chart Examples

Chart Examples

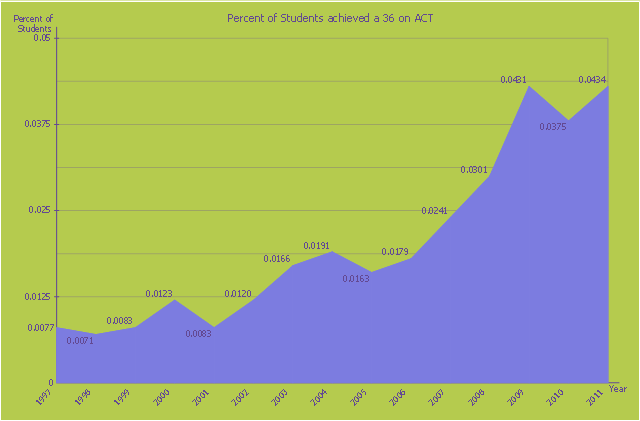
This area chart sample shows the percent of students achieved a 36 on ACT from 1997 to 2011. It was designed on the base of the Wikimedia Commons file: ACT-36-1997 to 2011.png. [commons.wikimedia.org/ wiki/ File:ACT-36-1997_ to_ 2011.png]
This file is licensed under the Creative Commons Attribution-Share Alike 3.0 Unported license. [creativecommons.org/ licenses/ by-sa/ 3.0/ deed.en]
"The ACT (originally an abbreviation of American College Testing) college readiness assessment is a standardized test for high school achievement and college admissions in the United States produced by ACT, Inc. ...
The required portion of the ACT is divided into four multiple choice subject tests: English, mathematics, reading, and science reasoning. Subject test scores range from 1 to 36; all scores are integers. The English, mathematics, and reading tests also have subscores ranging from 1 to 18. (The subject score is not the sum of the subscores.) The composite score is the average of all four tests. In addition, students taking the optional writing test receive a writing score ranging from 1 to 36 (This is a change from the previous 2–12 score range). The writing score does not affect the composite score." [ACT (test). Wikipedia]
The area graph example "Persent of Students achieved a 36 on ACT" was created using the ConceptDraw PRO diagramming and vector drawing software extended with the Area Charts solution from the Graphs and Charts area of ConceptDraw Solution Park.
Area chart
Venn Diagram Examples for Problem Solving. Environmental Social Science. Human Sustainability Confluence

Create Graphs and Charts

Lean Manufacturing Diagrams
 design elements")
This exploded pie chart example shows the ''preliminary'' results from the 2004 European Parliament election. It was designed on the base of the Wikimedia Commons file: Pie chart EP election 2004 exploded.png. [commons.wikimedia.org/ wiki/ File:Pie_ chart_ EP_ election_ 2004_ exploded.png].
This file is available under the Creative Commons Attribution-ShareAlike 3.0 Unported License. [creativecommons.org/ licenses/ by-sa/ 3.0/ ].
"Elections to the European Parliament take place every five years by universal adult suffrage. 751 MEPs (Members of the European Parliament) are elected to the European Parliament which has been directly elected since 1979. No other EU institution is directly elected, with the Council of the European Union and the European Council being only indirectly legitimated through national elections. While Europarties have the right to campaign EU-wide for the European elections, campaigns are still taking place through national election campaigns, advertising national delegates from national parties." [Elections to the European Parliament. Wikipedia]
The exploded pie chart example "European Parliament election" was created using the ConceptDraw PRO diagramming and vector drawing software extended with the Pie Charts solution of the Graphs and Charts area in ConceptDraw Solution Park.
Exploded pie chart
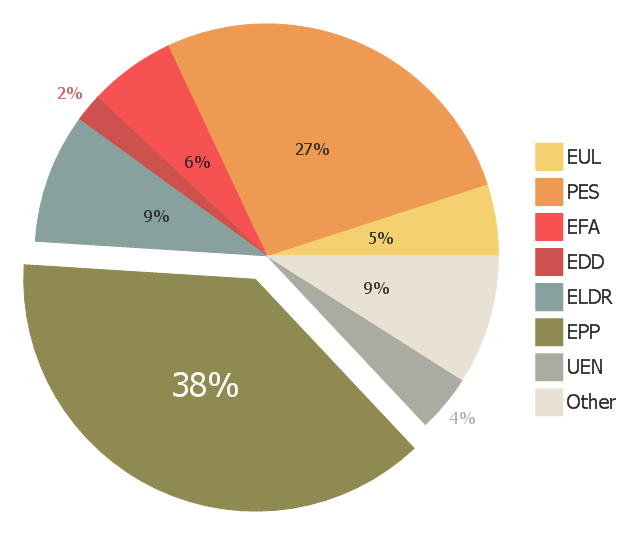
Chart Templates

- Bar Graph Png
- Percentage Chart Png
- Waterfall Bar Chart | SSADM Diagram | Design elements ...
- Internet Users Graph And Charts Full
- Png Clipart Double Arrows
- Exploded pie chart (percentage) - Template
- Financial Symbols Png
- European Parliament election | Exploded pie chart - European ...
- Pictures of Graphs | Pictures of Vegetables | Pictures of Food | Pict ...
- Exploded pie chart - European Parliament election | Pie Graph ...
- Pink Circle Png
- Percent Png
- Waterfall Bar Chart | Design elements - Geography | Geography ...
- How to Create a Line Chart | How to draw Metro Map style ...
- Outstanding trends of wastewater treatment plants | United States ...
- Rainfall Bar Chart | Renewable energy | Graph And Pie Chart On Rain
- Png Nature
- Percent of Students achieved a 36 on ACT | Percentage of the top 1 ...
- The Word Smart Png
- Pareto Chart | Seven Basic Tools of Quality - Pareto Chart | Design ...