This site uses cookies. By continuing to browse the ConceptDraw site you are agreeing to our Use of Site Cookies.
HelpDesk

How to Draw a Line Chart Quickly

A common line chart is a graphical representation of the functional relationship between two series of data. A line chart that is created by connecting a series of data points together with a straight line is the most basic type of a line chart. A line chart can be used for depicting data that changes continuously over time. It is extensively utilized in statistics, marketing, and financial business. ConceptDraw Basic Line Graph solution provides the possibility to make 2D line charts quickly and effortlessly.

draw line graph, draw line chart Line Graphs

draw line graph, draw line chart
How to draw a Line Graph with ease? The Line Graphs solution extends the capabilities of ConceptDraw DIAGRAM with professionally designed templates, samples, and a library of vector stencils for drawing perfect Line Graphs.

Line Chart Examples

The Line Graphs solution from Graphs and Charts area of ConceptDraw Solution Park contains a set of examples, templates and design elements library of line and scatter charts. Use it to draw line and scatter graphs using ConceptDraw DIAGRAM diagramming and vector drawing software for illustrating your documents, presentations and websites.

Line Chart Template for Word

This sample was created in ConceptDraw DIAGRAM diagramming and vector drawing software using the Line Graphs Solution from Graphs and Charts area of ConceptDraw Solution Park.
This sample shows the Line Chart of annual percentage change. The Line Chart allows you to clearly see the changes of data over the time.

How to draw Metro Map style infographics? (Moscow)

Tool to draw Metro Map styled inforgraphics. Moscow Metro sample.

Line Graph Charting Software

To design line and scatter charts use ConceptDraw DIAGRAM diagramming and vector drawing software extended with Line Graphs solution from Graphs and Charts area of ConceptDraw DIAGRAM Solution Park. (Line chart, scatter chart, 2d chart).
HelpDesk

How to Create a Time Series Dashboard

Time Series Dashboard means integration of some type of diagrams: Line Charts, Bar Charts, Column Charts, and Dot Plots on a single space. The ConceptDraw Time Series Dashboard solution can be used to create the interactive Time Series dashboard. The libraries of Time Series Charts solution contain the Live Objects, that can change their appearance depending on the external data. Each chart from the Time Series dashboard displays particular source data. You can include Time Series Charts in your business or technical dashboards to show and compare the items changing over time.

Create Organizational Chart

CSOdessa team is happy to provide cost effective Organizational Chart Software for companies of any size. It is a ConceptDraw DIAGRAM extended with Organizational Charts Solution from the Management Area.
ConceptDraw DIAGRAM organizational chart professional software allows quickly create organizational charts, flow charts, time lines, and much more. Use it for drawing organizational chart for any size company and analyzing organizational structure. Use ConceptDraw to create organizational chart, visualize company Organizational chart, hospital Organizational chart, hotel Organizational chart, corporate organizational chart, etc.
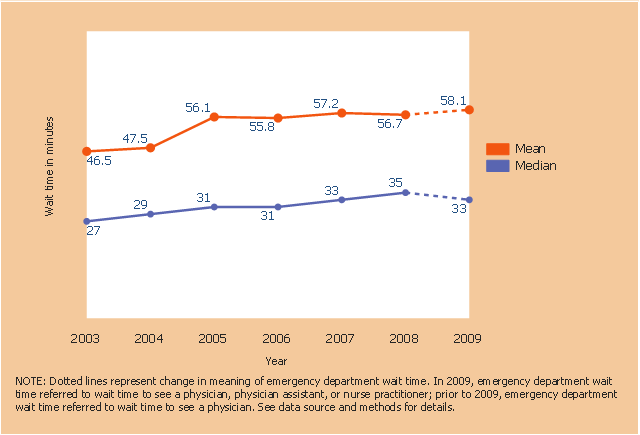
This line graph sample shows the mean and median wait time for treatment in hospital emergency department: United States, 2003–2009. Dotted lines represent change in meaning of emergency department wait time. In 2009, emergency department wait time referred to wait time to see a physician, physician assistant, or nurse practitioner; prior to 2009, emergency department wait time referred to wait time to see a physician.
This line graph was designed on the base of line graph from the website of National Center for Health Statistics, Centers for Disease Control and Prevention (CDC), U.S. Department of Health & Human Services.
[cdc.gov/ nchs/ products/ databriefs/ db102.htm]
The line chart example "Wait time for treatment in hospital emergency departments" was created using the ConceptDraw PRO diagramming and vector drawing software extended with the Line Graphs solution from the Graphs and Charts area of ConceptDraw Solution Park.
Line chart
Line chart, serial line chart, line graph,

How to draw Metro Map style infographics? (Los Angeles)

Tool to draw Metro Map styled inforgraphics. Los Angeles Metro Rail and Liner sample.
This is a one-click tool to add stations to the map. It lets you control the direction in which you create new stations, change lengths, and add text labels and icons. It contains Lines, Stations, and Landmarks objects.

Shotgun Formation (Offense) Diagram

The Football solution for ConceptDraw DIAGRAM software contains a set of libraries, templates and samples allowing football specialists to draw football diagrams with ease. A set of predesigned fields and positions allows producing football diagrams without any drawing experience.

Line Graph

Looking for the line graph examples you can simply go to the Line Graphs solution of ConceptDraw STORE to get those which were previously created especially for the ConceptDraw DIAGRAM users in order to simplify their work of making such charts.

Infographic software: the sample of New York City Subway map

Tool to draw Metro Map styled inforgraphics. New York City Subway map sample.

Percentage Pie Chart. Pie Chart Examples

This sample was created in ConceptDraw DIAGRAM diagramming and vector drawing software using the Pie Charts Solution from Graphs and Charts area of ConceptDraw Solution Park.
This sample shows the Pie Chart of the approximate air composition. You can see the percentage of oxygen, nitrogen and other gases in the air visualized on this Pie Chart.

Polar Graph

This sample shows the Polar Graph. The Polar Graph is a graph in the polar coordinate system in which the each point on the plane is defined by two values - the polar angle and the polar radius. The certain equations have very complex graphs in the Cartesian coordinates, but the application of the polar coordinate system allows usually produce the simple Polar Graphs for these equations.

Defensive Strategy Diagram – 46 Defence

Drawing defensive strategy diagrams using ConceptDraw DIAGRAM software extended with the Football solution saves your time, and adds more value to your work. You can easily convert vector drawing to a popular graphic format and then post it to your blog or site. There is no problem to add your logo or text copyright, or use some text comments to make your diagrams unique and recognizable.

Physics Symbols

ConceptDraw DIAGRAM diagramming and vector drawing software extended with Physics solution from the Science and Education area is a powerful software for creating various physics diagrams.
Physics solution provides all tools that you can need for physics diagrams designing. It includes 3 libraries with predesigned vector physics symbols: Optics Library, Mechanics Library and Nuclear Physics Library.

Line Chart Templates

The Line Graphs solution from Graphs and Charts area of ConceptDraw Solution Park contains a set of examples, templates and design elements library of line and scatter charts. Use it to draw line and scatter graphs using ConceptDraw DIAGRAM diagramming and vector drawing software for illustrating your documents, presentations and websites.

Line Chart

You want to draw the Line Chart and need the automated tool? Now it is reality with Line Graphs solution from Graphs and Charts area of ConceptDraw Solution Park.

Gantt Chart Software

ConceptDraw PROJECT is a powerful Gantt Chart Software. The Gantt Charts are useful for displaying a large amount of detailed information, project tasks and timelines in a visually pleasing, easy-to-understand format.
ConceptDraw PROJECT provides wide capabilities of importing and exporting in various formats: Microsoft Project, ConceptDraw MINDMAP , Mindjet MindManager, PDF file.