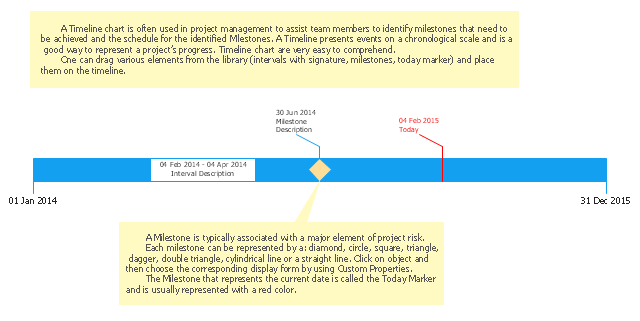
Timeline charts presents events and time periods on a chronological scale. They are used in project management to visualize project milestones and upper level phases, and show project progress.
"Time is one of the most critical resources in any project. Good planning spreads the necessary work over a reasonable period of time. This allows everyone to work at a consistent, sustainable pace. Poor planning leaves people stuck and idle, then forces them to scramble to catch up later on. While it does take time to plan ahead, the time ... saved more than make up for it. Good planning is a part of good doing. ...
A Timeline is a clean and concise visual representation of a series of events. It helps you to arrange large chunks of time and see the overall plan easily." [education.rec.ri.cmu.edu/ previews/ nxt_ products/ robotics_ eng_ vol_ 2/ preview/ content/ timeline.pdf]
This timeline template for the ConceptDraw PRO diagramming and vector drawing software is included in the Timeline Diagrams solution from the Management area of ConceptDraw Solution Park.
Timeline template
 Management
This solution extends ConceptDraw PRO v9 and ConceptDraw MINDMAP v7 with Management Diagrams and Mind Maps (decision making, scheduling, thinking ideas, problem solving, business planning, company organizing, SWOT analysis, preparing and holding meetings
 Business Processes
Business Process solution extends ConceptDraw PRO software with business process diagrams as cross-functional flowcharts, workflows, process charts, IDEF0, timelines, calendars, Gantt charts, business process modeling, audit and opportunity flowcharts.
 Marketing
This solution extends ConceptDraw PRO v9 and ConceptDraw MINDMAP v7 with Marketing Diagrams and Mind Maps (brainstorming, preparing and holding meetings and presentations, sales calls).
 Timeline Diagrams
Timeline Diagrams solution extends ConceptDraw PRO software with templates, samples and library of vector stencils for drawing the timeline and milestones diagrams.
Line Chart Template for Word

This sample shows the Line Chart of annual percentage change. The Line Chart allows you to clearly see the changes of data over the time.
 ConceptDraw Solution Park
ConceptDraw Solution Park collects graphic extensions, examples and learning materials
 Quality
This solution extends ConceptDraw PRO v9 and ConceptDraw MINDMAP v7 with Quality Management Diagrams (Total Quality Management Diagrams, Timelines, Workflows, Value Stream Maps) and Mind Maps (Presentations, Meeting Agendas, Problem to be solved).
Chart Templates

 Graphs and Charts Area
Solutions from the Graphs and Charts Area of ConceptDraw Solution Park collect templates, samples and libraries of vector stencils for visualization of numerical data.
"A chart can take a large variety of forms, however there are common features that provide the chart with its ability to extract meaning from data.
Typically the data in a chart is represented graphically, since humans are generally able to infer meaning from pictures quicker than from text. Text is generally used only to annotate the data.
One of the more important uses of text in a graph is the title. A graph's title usually appears above the main graphic and provides a succinct description of what the data in the graph refers to.
Dimensions in the data are often displayed on axes. If a horizontal and a vertical axis are used, they are usually referred to as the x-axis and y-axis respectively. Each axis will have a scale, denoted by periodic graduations and usually accompanied by numerical or categorical indications. Each axis will typically also have a label displayed outside or beside it, briefly describing the dimension represented. If the scale is numerical, the label will often be suffixed with the unit of that scale in parentheses. ...
Within the graph a grid of lines may appear to aid in the visual alignment of data. The grid can be enhanced by visually emphasizing the lines at regular or significant graduations. The emphasized lines are then called major grid lines and the remainder are minor grid lines.
The data of a chart can appear in all manner of formats, and may include individual textual labels describing the datum associated with the indicated position in the chart. The data may appear as dots or shapes, connected or unconnected, and in any combination of colors and patterns. Inferences or points of interest can be overlaid directly on the graph to further aid information extraction.
When the data appearing in a chart contains multiple variables, the chart may include a legend (also known as a key). A legend contains a list of the variables appearing in the chart and an example of their appearance. This information allows the data from each variable to be identified in the chart." [Chart. Wikipedia]
The vector stencils library "Time series charts" contains 10 templates: 3 column charts, 3 bar charts, 2 line graphs and 2 dot plots. All these charts are Live Objects displaying the data from external data source files.
Use these chart templates to design your business performance digital dashboards using the ConceptDraw PRO diagramming and vector drawing software.
The example "Design elements - Time series charts" is included in the Time Series Dashboard solution from the area "What is a Dashboard" of ConceptDraw Solution Park.
Time series charts

 Line Graphs
How to draw a Line Graph with ease? The Line Graphs solution extends the capabilities of ConceptDraw PRO v10 with professionally designed templates, samples, and a library of vector stencils for drawing perfect Line Graphs.
Line Chart Examples

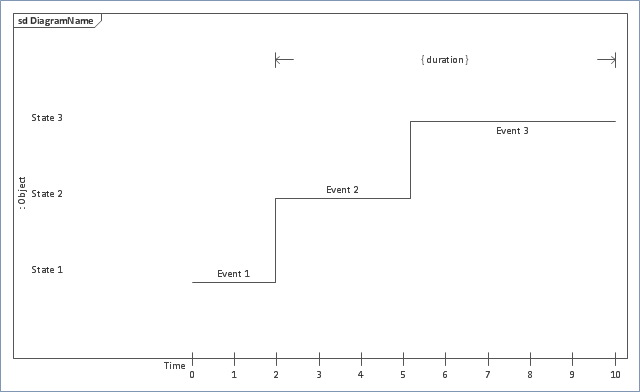
"Timing diagrams are UML interaction diagrams used to show interactions when a primary purpose of the diagram is to reason about time. Timing diagrams focus on conditions changing within and among lifelines along a linear time axis. Timing diagrams describe behavior of both individual classifiers and interactions of classifiers, focusing attention on time of events causing changes in the modeled conditions of the lifelines.
The following nodes and edges are typically drawn in a UML timing diagram: lifeline, state or condition timeline, destruction event, duration constraint, time constraint." [uml-diagrams.org/ timing-diagrams.html]
The template "UML timing diagram" for the ConceptDraw PRO diagramming and vector drawing software is included in the Rapid UML solution from the Software Development area of ConceptDraw Solution Park.
www.conceptdraw.com/ solution-park/ software-uml
UML timing diagram
 Time Series Dashboard
Time series dashboard solution extends ConceptDraw PRO software with templates, samples and vector stencils libraries with charts, graphs and plots for drawing the visual dashboards showing data time series.
Line Graph Charting Software

 Area Charts
Area Charts are used to display the cumulative totals over time using numbers or percentages; or to show trends over time among related attributes. The Area Chart is effective when comparing two or more quantities. Each series of data is typically represented with a different color, the use of color transparency in an object’s transparency shows overlapped areas and smaller areas hidden behind larger areas.
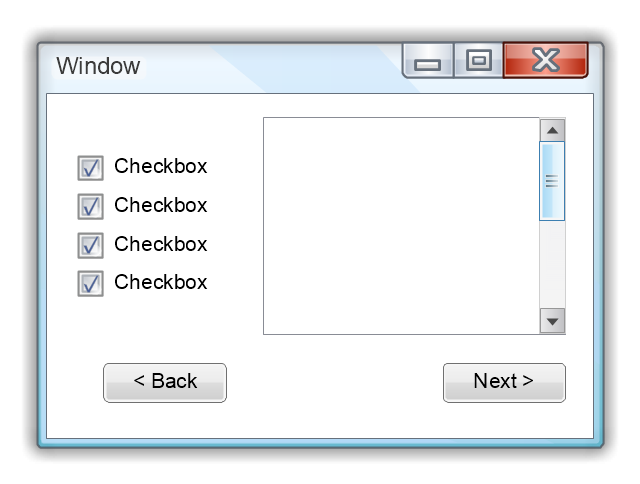
Use this template to prototype and design the Windows graphic user interface.
"In human–computer interaction, WIMP stands for "windows, icons, menus, pointer", denoting a style of interaction using these elements of the user interface. ... Other expansions are sometimes used, substituting "mouse" and "mice" or "pull-down menu" and "pointing", for menus and pointer, respectively. ...
In a WIMP system:
(1) A window runs a self-contained program, isolated from other programs that (if in a multi-program operating system) run at the same time in other windows.
(2) An icon acts as a shortcut to an action the computer performs (e.g., execute a program or task).
(3) A menu is a text or icon-based selection system that selects and executes programs or tasks.
(4) The pointer is an onscreen symbol that represents movement of a physical device that the user controls to select icons, data elements, etc.
(5) cut, copy, and paste.
This style of system improves human–computer interaction (HCI) by emulating real-world interactions and providing better ease of use for non-technical people - both novice and power users. Users can carry skill at a standardized interface from one application to another.
Due to the nature of the WIMP system, simple commands can be chained together to undertake a group of commands that would have taken several lines of command line instructions." [WIMP (computing). Wikipedia]
The Windows Vista graphic user interface template for the ConceptDraw PRO diagramming and vector drawing software is included in the Graphic User Interface solution from the Software Development area of ConceptDraw Solution Park.
Windows GUI template
- Timeline template | Examples of Flowcharts, Org Charts and More ...
- Timeline template | Timeline template | Business diagrams & Org ...
- Timeline Diagrams | Timeline diagram template | Project timeline ...
- Timeline template | Timeline template | Marketing | - Conceptdraw.com
- Timeline Diagrams | Timeline template | Timeline diagram |
- Timeline Diagrams | Timeline template | Timeline diagram |
- Timeline template | What is Infographics Area | - Conceptdraw.com
- Timeline template | Marketing | Management | - Conceptdraw.com
- Timeline Diagrams | Timeline diagram template | Timeline diagram ...
- Timeline Diagrams | Management | Marketing |
- Timeline Diagrams | Line Chart Examples | Line Graph Charting ...
- Design elements - Timelines solution | Timeline diagram template ...
- Timeline diagram template | Timeline diagram | Project timeline ...
- Timeline Diagrams | Timeline diagram template | Seven ...
- Timeline Diagrams | Management | Business Processes |
- Timeline Diagrams | Management | Seven Management and ...
- Gantt Chart Software | How to Report Task's Execution with Gantt ...
- Timeline Diagrams | Business diagrams & Org Charts with ...
- Business Processes | Timeline Diagrams | Business diagrams & Org ...
- Project timeline diagram - Conceptdraw.com