HelpDesk
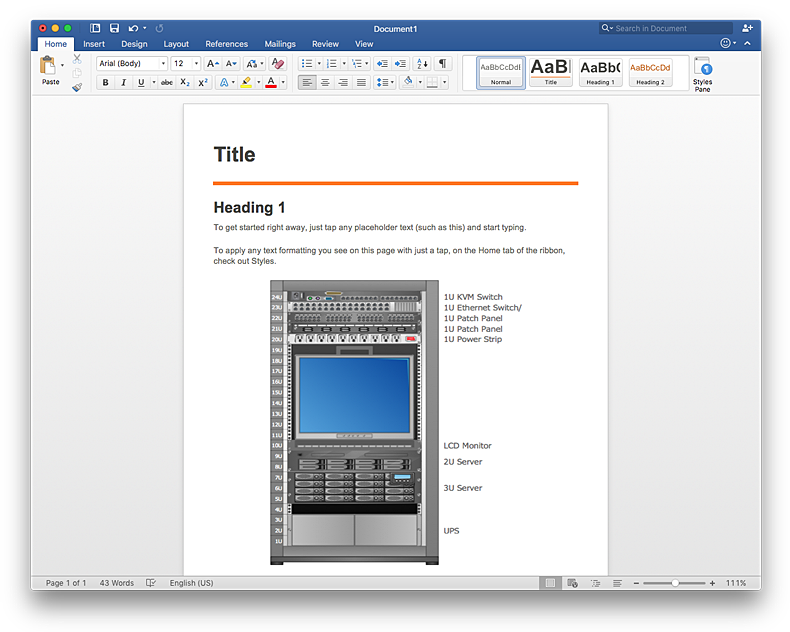
How to Add a Rack Diagram to a MS Word Document Using ConceptDraw PRO
Rack Diagram depicts the structure of network equipment installation, and provides network administrator with the base to support electronic equipment, power, cooling, and cable management. ConceptDraw PRO allows you to easily create diagram that will help to detail the type of rack equipment that best fits your needs and then lets you to insert the scheme of rack configuration into the network documentation pack. ConceptDraw PRO allows you to easily create rack configuration diagrams and then insert them into a MS Word document.HelpDesk
How to Add a Block Diagram to a PowerPoint Presentation Using ConceptDraw PRO
Block diagram is rather universal type of charts - compositions from geometric blocks can be applied to describe various kinds of processes or systems, consisting from components, which depend on each other. Block diagrams are indispensable when you need to represent a process or system on a basic level. With blocks, you can easily depict the basic elements of the process, without drilling down. The PowerPoint presentation of major process steps and key process participants can be very informative and helpful. Using ConceptDraw PRO, you can easily convert a block diagram to MS PowerPoint presentation.How to Draw Business Process Diagrams with RapidDraw Interface
Business Process Modeling Notation (BPMN) is a set of standard symbols that allow you to create a graphical view of a business process. The symbols were developed to help users develop standard, unified structure of processes, and any messages shared between these processes.HelpDesk
How to Create a Fishbone (Ishikawa) Diagram Quickly
A Fishbone (Ishikawa) diagram is also called cause-and-effect diagram. Fishbone diagram is often used in business to determine the cause of some problem. The diagram illustrates the main causes and sub-causes leading to an event. The main goal of the Fishbone diagram is to illustrate in a graphical way the relationship between a given outcome and all the factors that influence this outcome. The complete diagram resembles a fish skeleton as its name implies. The ability to create a Fishbone Diagram is supported by the Fishbone Diagram solution. Use ConceptDraw MINDMAP for structuring data and then ConceptDraw PRO for generating a Fishbone Diagram from mind map structure.HelpDesk
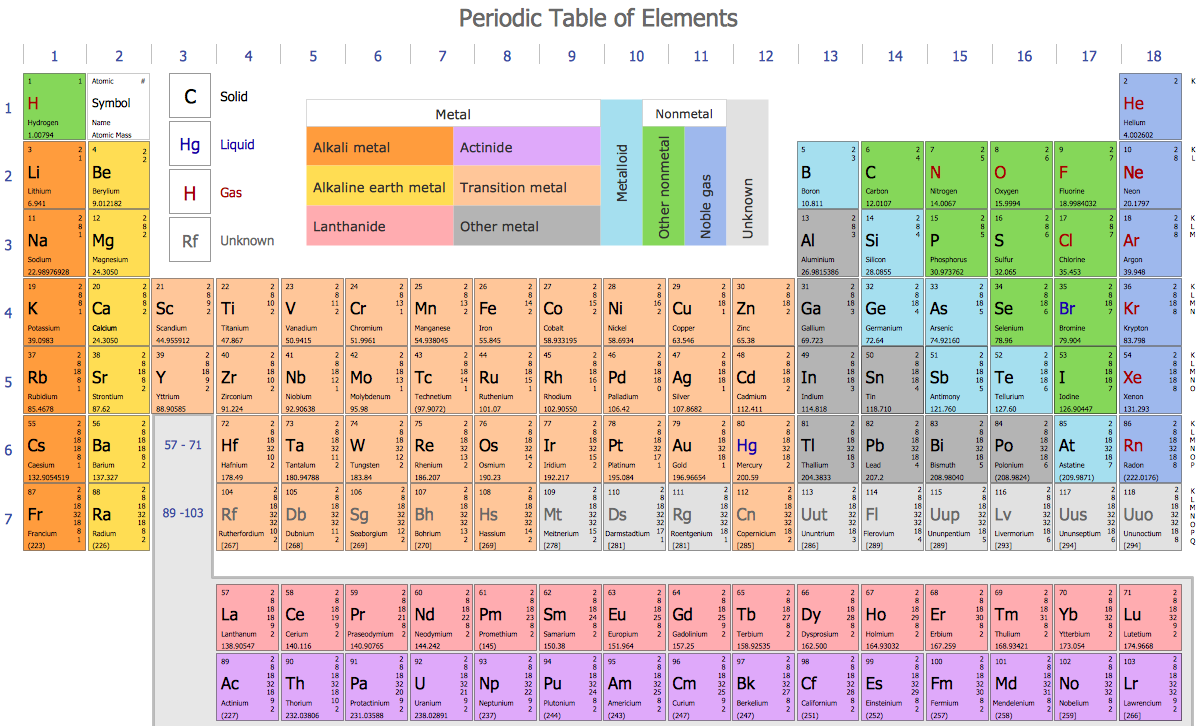
How to Draw Chemistry Structures
Making chemistry drawings for science and education purposes involves many different elements that can be managed using ConceptDraw PRO. ConceptDraw Chemistry solution can be used as a tool for creating chemical schemes and diagrams of chemical lab set-ups and labware, formulas, reaction schemes, and molecular structures. With ConceptDraw PRO you can easily create and communicate chemistry drawings of any complexity.- How To Draw Complete Diagram Using Power
- How to Draw a Computer Network Diagrams | Complete Network ...
- Draw Complete Power System Diagram
- How To use House Electrical Plan Software | Electrical Drawing ...
- How to Draw a Computer Network Diagrams | Network Topologies ...
- Electrical Symbols, Electrical Diagram Symbols | Technical Drawing ...
- Basketball Diagram Power Point Template
- Power Park To Draw
- Network diagrams with ConceptDraw PRO | Network Diagram ...
- Draw And Explain The Layout Electrical Power System
- How to Add a Block Diagram to a MS Word ™ Document Using ...
- Technical Drawing Software | Electrical Symbols, Electrical Diagram ...
- Technical Drawing Software | Mechanical Drawing Symbols ...
- How to Make a Basketball Court Diagram | Basketball Plays ...
- Network diagrams with ConceptDraw PRO | Personal area (PAN ...
- Process Flowchart | Procedure To Use To Contrust Block Diagram ...
- Draw Layout Diagram Of A Power System
- Electrical Symbols, Electrical Diagram Symbols | Technical Drawing ...
- Electrical Symbols, Electrical Diagram Symbols | How To use House ...
- Block Diagrams | UML Block Diagram | Functional Block Diagram ...
- ERD | Entity Relationship Diagrams, ERD Software for Mac and Win
- Flowchart | Basic Flowchart Symbols and Meaning
- Flowchart | Flowchart Design - Symbols, Shapes, Stencils and Icons
- Flowchart | Flow Chart Symbols
- Electrical | Electrical Drawing - Wiring and Circuits Schematics
- Flowchart | Common Flowchart Symbols
- Flowchart | Common Flowchart Symbols


