HelpDesk
How to Make a Basketball Court Diagram
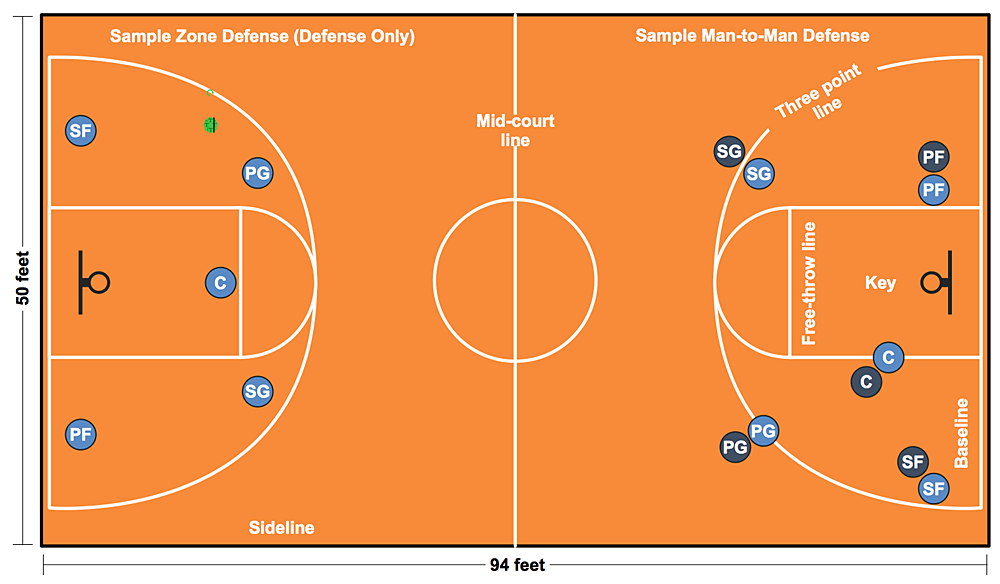
Basketball Court diagrams is often used as a teaching and learning tool for coaches, players and parents to describe the basketball moves and shooting drills. The ability to create Basketball diagrams with ConceptDraw PRO is contained in the Basketball solution. It provides a set of special tools for creating different Basketball diagrams. Basketball court diagram is used to describe basketball moves and shooting drills during the discussion of the match, as well as to develop a winning defense and attack strategy as a clear visual plans for future games.
 Basketball
The Basketball Solution extends ConceptDraw PRO v9.5 (or later) software with samples, templates, and libraries of vector objects for drawing basketball diagrams, plays schemas, and illustrations. It can be used to make professional looking documents, pre
HelpDesk
How to Create Multipage Diagram
Most ConceptDraw PRO templates are one page in length. Some templates consist of two pages: the first page — as the main page, and a second page as the background page. You can customize any template for your needs by adding pages, rearranging them, or by setting a custom background.HelpDesk
How to Add a Circle-Spoke Diagram to a MS Word Document Using ConceptDraw PRO
ConceptDraw PRO allows you to easily create various marketing charts, including the circle-spoke diagrams and then insert them into a MS Word document.
 Data Flow Diagrams (DFD)
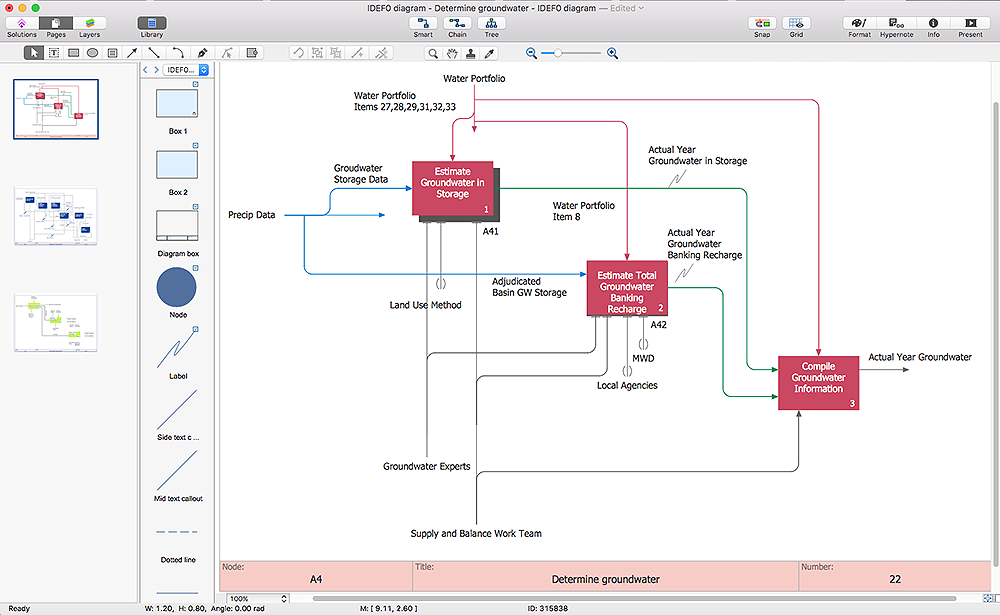
Data Flow Diagrams solution extends ConceptDraw PRO software with templates, samples and libraries of vector stencils for drawing the data flow diagrams (DFD).
HelpDesk
How to Diagram Sentences in ConceptDraw PRO
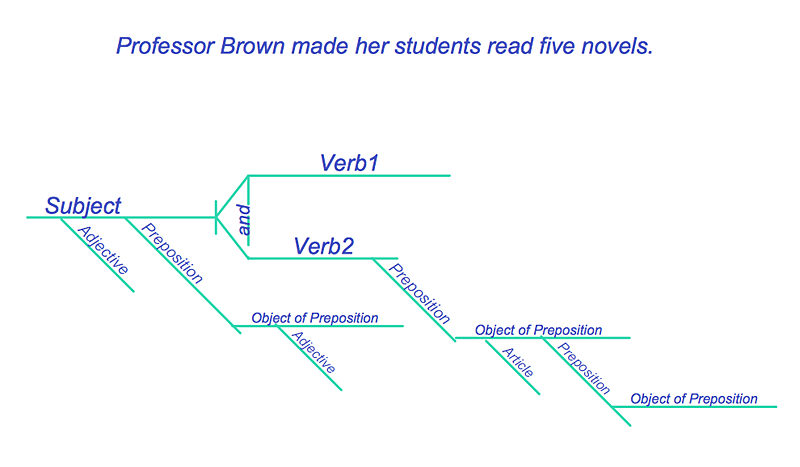
Diagramming sentences is a playful, fun way to learning English Grammer. Sentences can be very complex, and can contain many different parts of speech which implicate many different grammatical rules. Diagramming sentences will help you to make sure every parts of your sentence are grammatically correct, and provides you with more comprehensive understanding of the English Language. A Sentence Diagram displays the parts of a sentence as a diagram in order to show the relationship of words and groups of words within the sentence. Sentence Diagram shows the relationship between the proposal of its parts. This is a good way to teach grammar! Sentence Diagram helps to make the writing more coherent as well as more interesting to read. ConceptDraw PRO allows you to create clear sentence diagrams using the special templates and vector stencils library.HelpDesk
How to Add a Bubble Diagram to a PowerPoint Presentation Using ConceptDraw PRO
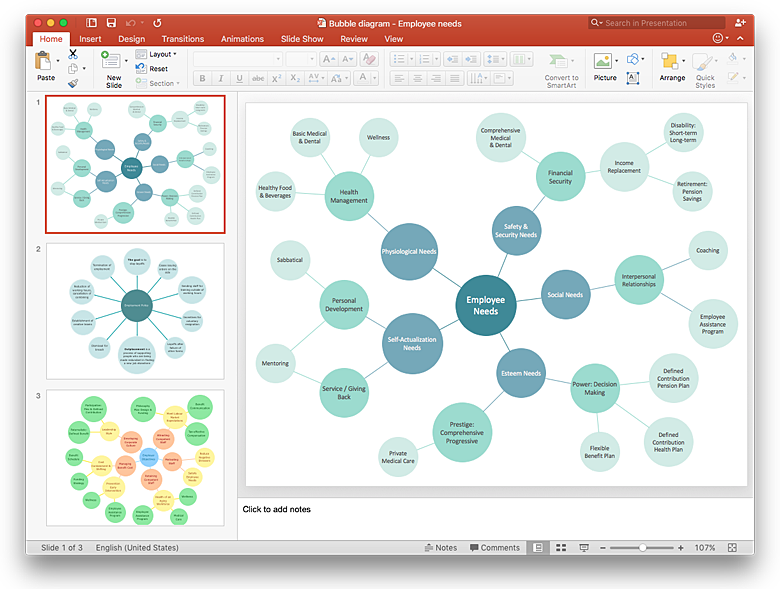
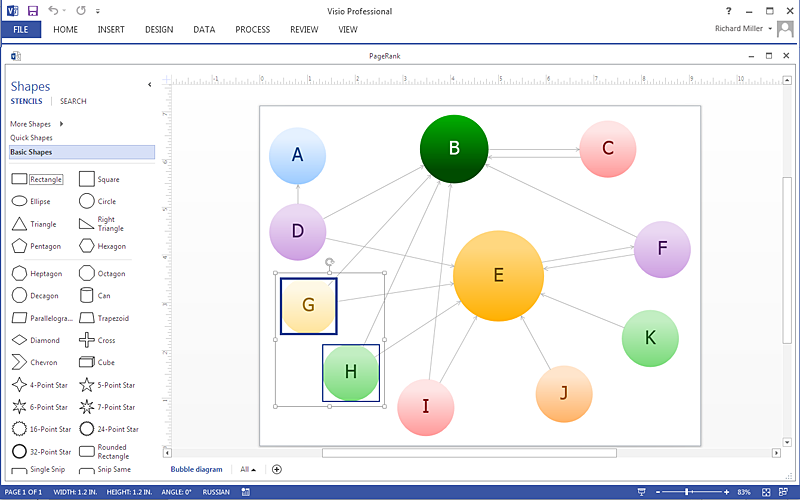
Bubble diagrams can be used to compare concepts, and identify areas of similarity and difference. ConceptDraw PRO allows you to make a MS PowerPoint Presentation from your charts in a few simple steps.HelpDesk
How to Draw a Pyramid Diagram in ConceptDraw PRO
Pyramid diagram (triangle diagram) is used to represent data, which have hierarchy and basics. Due to the triangular form of diagram, each pyramid section has a different width. The width of the segment shows the level of its hierarchy. Typically, the top of the pyramid is the data that are more important than the base data. Pyramid scheme can be used to show proportional and hierarchical relationships between some logically related items, such as departments within an organization, or successive elements of any process. This type of diagram is often used in marketing to display hierarchical related data, but it can be used in a variety of situations. ConceptDraw PRO allows you to make a pyramid diagram, quickly and easily using special libraries.HelpDesk
How to Create an Interactive Voice Response (IVR) Diagram in ConceptDraw PRO
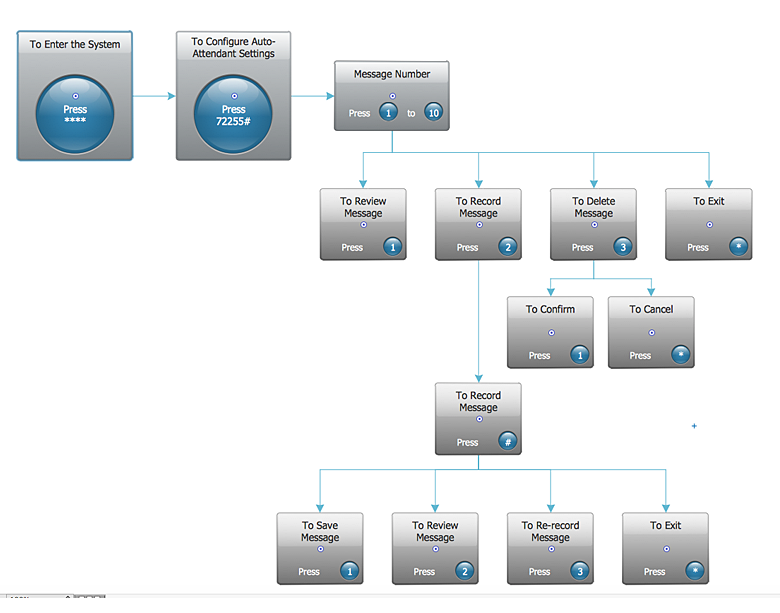
Interactive Voice Response (IVR) Diagram is used to create and conduct the Interactive Voice Response systems for call-centers and voice mail services. IVR diagrams intended to visualize the logical and physical structure of Interactive voice response systems. ConceptDraw solution for Interactive Voice Response (IVR) Diagram allows you to create and communicate the Interactive Voice Response diagram of any complexity. Interactive Voice Response (IVR) System is a telecommunication technology that enables a computer to automatically process voice and touch phone signals. IVR systems allows users to interact through a computer with various service systems, available by telephone. The objective of IVR system is to reduce customer service costs by delivering self service to customers and guiding them to the information that they look for.HelpDesk
How To Create a Visio Bubble Chart Using ConceptDraw PRO
ConceptDraw PRO allows you to easily create business charts and diagrams of any complexity, including the bubbles diagram and then make a MS Visio file from your diagram in a few simple steps.HelpDesk
How to Create a UML Diagram Quickly
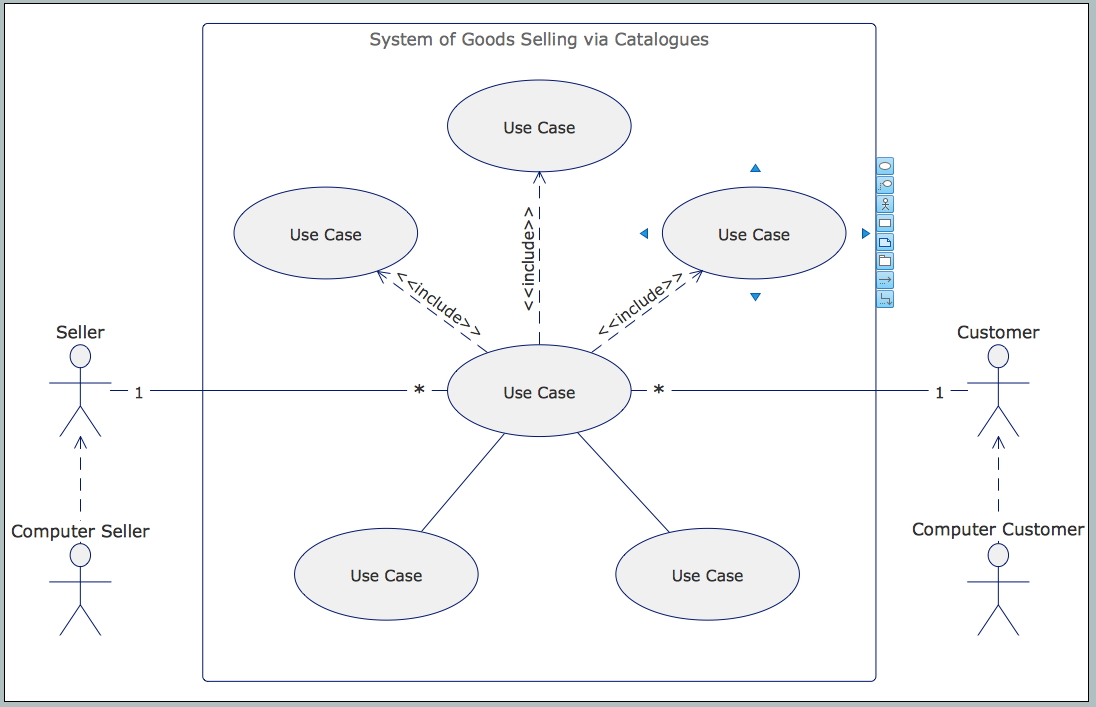
UML diagramming software with rich examples and template. ConceptDraw is ideal for software designers and software developers who need to draw UML Diagrams- Basketball | Basketball Court Diagram and Basketball Positions ...
- Local area network (LAN). Computer and Network Examples ...
- Basketball Court Diagram and Basketball Positions | Basketball ...
- How To Draw Complete Diagram Using Power
- Examples of Flowcharts, Org Charts and More | Building Networks ...
- Basketball Court Diagram and Basketball Positions | Basketball ...
- Project planning process - Flowchart | Basketball Court Dimensions ...
- ConceptDraw Solution Park | Basketball Court Dimensions ...
- Basketball Court Diagram and Basketball Positions | Soccer ...
- Basketball Court Dimensions | Basketball Court Diagram and ...
- Soccer (Football) Formation | Soccer (Football) Diagram Software ...
- Rack Diagrams | Computer Network Diagrams | Basketball | 9 5 ...
- Basketball Plays Software | Offensive Play – Double Wing Wedge ...
- Basketball Plays Software | Basketball | Basketball Illustrations ...
- Offensive Play – Double Wing Wedge – Vector Graphic Diagram ...
- Basketball Illustrations | Basketball | Basketball Plays Diagrams ...
- Flow Diagram Of Schools Management Structure
- Basketball plays
- Basketball courts - Vector stencils library | Basketball Court ...
