HelpDesk
How to Operate with Project Time Frames in ConceptDraw PROJECT

HelpDesk
How to Shift Dates in ConceptDraw PROJECT

How To Do A Mind Map In PowerPoint

Product Overview

 iPhone User Interface
iPhone User Interface solution extends ConceptDraw PRO v10 software with templates, samples and libraries with large quantity of vector stencils of graphical user interface elements, Apps icons, UI patterns for designing and prototyping of the iOS applic
Gant Chart in Project Management


How to Create Presentation of Your Project Gantt Chart

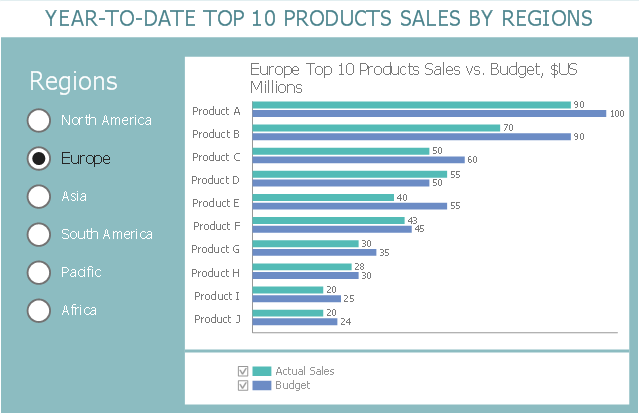
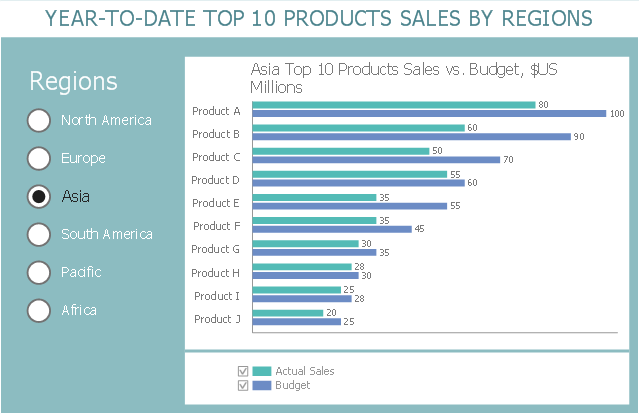
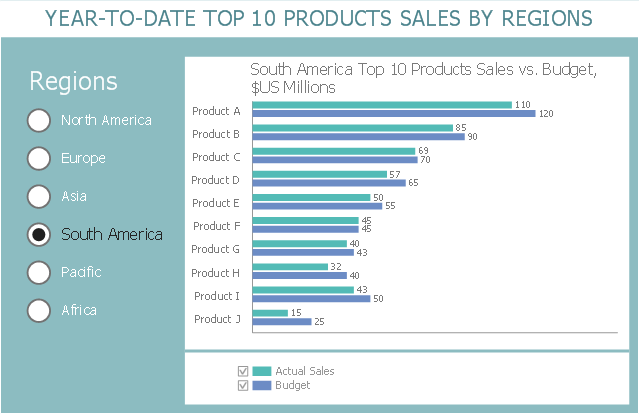
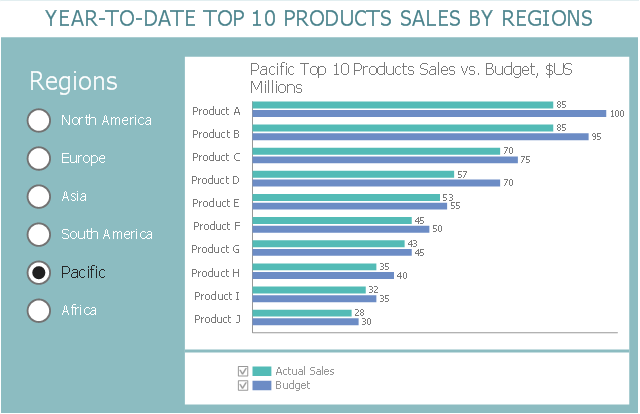
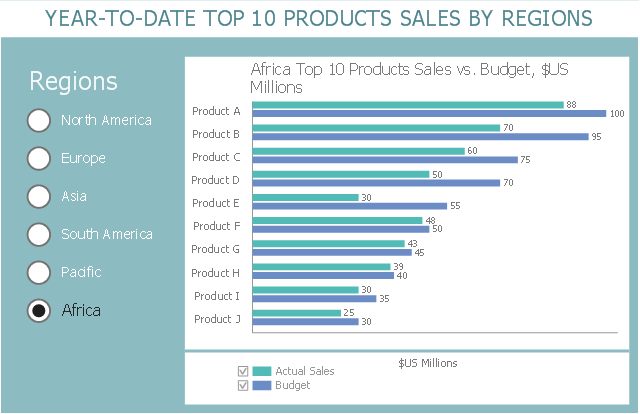
This business intelligence dashboard sample shows the year-to-date top 10 products sales by regions using horizontal bar charts.
"Dashboards often provide at-a-glance views of KPIs (key performance indicators) relevant to a particular objective or business process (e.g. sales, marketing, human resources, or production). In real-world terms, "dashboard" is another name for "progress report" or "report."" [Dashboard (business). Wikipedia]
The BI dashboard example "Year-to-date Top 10 Products Sales by Regions" was created using ConceptDraw PRO software extended with the Business Intelligence Dashboards solution from the Business Processes area of ConceptDraw Solution Park.
North America

Europe
Asia
South America
Pacific
Africa
HelpDesk
What Information to be Displayed in the ConceptDraw PROJECT Gantt Chart View


HelpDesk
How to Import Project Data From MS Excel File

 Sales Flowcharts
The Sales Flowcharts solution lets you create and display sales process maps, sales process workflows, sales steps, the sales process, and anything else involving sales process management.
HelpDesk
How to Create an Effective Mind Map Using Topic Types


HelpDesk
What Information can be Displayed in the Multiproject Dashboard View

HelpDesk
How to Change the Working Time in a Project

- iPhone interface - Vector stencils library | Radio Checkbox Ios Png ...
- Ios Header Png
- Clock 24 Pictogram Png
- Progress Bar Images Png
- Message Png Iphone
- Iphone Symbol Png
- Hourglass Illustration Png
- Half Circle Png
- Watch Vector Png
- Png Photo Modal
- 24 Hours Icon Illustration Png
- Wrist Watch Vector Png
- Ios Refresh Icon Line Png
- Png In 24 Hours
- Iphone Screen Png
- Iphone Camera Png
- Png Images Iphone Icons
- Png Arrow Navigation
- Pistol Drill Png
- Pause Png
- ERD | Entity Relationship Diagrams, ERD Software for Mac and Win
- Flowchart | Basic Flowchart Symbols and Meaning
- Flowchart | Flowchart Design - Symbols, Shapes, Stencils and Icons
- Flowchart | Flow Chart Symbols
- Electrical | Electrical Drawing - Wiring and Circuits Schematics
- Flowchart | Common Flowchart Symbols
- Flowchart | Common Flowchart Symbols