The vector stencils library "HR steps" contains 32 HR workflow symbols.
Use this HR icon set to draw your HR flowcharts, workflow diagrams and process charts with the ConceptDraw PRO diagramming and vector drawing software.
The HR pictograms library "HR steps" is included in the HR Flowcharts solution from the Management area of ConceptDraw Solution Park.
Use this HR icon set to draw your HR flowcharts, workflow diagrams and process charts with the ConceptDraw PRO diagramming and vector drawing software.
The HR pictograms library "HR steps" is included in the HR Flowcharts solution from the Management area of ConceptDraw Solution Park.
Accept

Agree

Analyze

Appraisal

Attention

Сheckbox

Checkout

Commit

Grievance procedures

Hand over

Interview

Job analysis

Job offer

Job search

Learning

Log in

Manual filling

Meeting

Pay

Phone interview

Presentation

Problem

Question

Receive

Refuse

Run

Secure payment

Select staff

Shipping

Stop

Synchronization

Video conference

The vector stencils library "HR steps" contains 32 HR workflow symbols.
Use this HR icon set to draw your HR flowcharts, workflow diagrams and process charts with the ConceptDraw PRO diagramming and vector drawing software.
The HR pictograms library "HR steps" is included in the HR Flowcharts solution from the Management area of ConceptDraw Solution Park.
Use this HR icon set to draw your HR flowcharts, workflow diagrams and process charts with the ConceptDraw PRO diagramming and vector drawing software.
The HR pictograms library "HR steps" is included in the HR Flowcharts solution from the Management area of ConceptDraw Solution Park.
Accept
Agree
Analyze
Appraisal
Attention
Сheckbox
Checkout
Commit
Grievance procedures
Hand over
Interview
Job analysis
Job offer
Job search
Learning
Log in
Manual filling
Meeting
Pay
Phone interview
Presentation
Problem
Question
Receive
Refuse
Run
Secure payment
Select staff
Shipping
Stop
Synchronization
Video conference
Ishikawa Diagram

ConceptDraw DIAGRAM diagramming and vector drawing software extended with Fishbone Diagrams solution from the Management area can help you with construction the Fishbone Diagram also known as Ishikawa Diagram.
Ishikawa Diagram shows factors of Equipment, Process, People, Materials, Environment and Management, all affecting the overall problem in one drawing for the further analysis. It is a well effective way to analyze the business problems you must identify and solve.
Marketing Analysis Diagram

Cause and Effect Analysis

The vector stencils library "Sales steps" contains 23 sales steps symbols.
Use these sales pictograms to draw your sales flowcharts, workflow diagrams and process charts with the ConceptDraw PRO diagramming and vector drawing software.
The vector stencils library "Sales steps" is included in the Sales Flowcharts solution from the Marketing area of ConceptDraw Solution Park.
Accept

Agree

Analyze

Attention

Сheckbox

Checkout

Commit

Hand over

Log in

Manual filling

Meeting

Pay

Phone

Presentation

Problem

Question

Receive

Refuse

Run

Secure payment

Shipping

Stop

Synchronization

Structured Systems Analysis and Design Method (SSADM) with ConceptDraw DIAGRAM

Growth-Share Matrix Software

The Matrices Solution also provides a wide variety of templates and samples that will help you to create the Matrix diagrams of any difficulty.
BCG Matrix

Fishbone Diagram Example

Fishbone Diagrams solution included to ConceptDraw Solution Park contains powerful drawing tools and a lot of examples, samples and templates. Each Fishbone diagram example is carefully thought-out by experts and is perfect source of inspiration for you.
SWOT Matrix Template

Work Flow Process Chart

TOWS Analysis
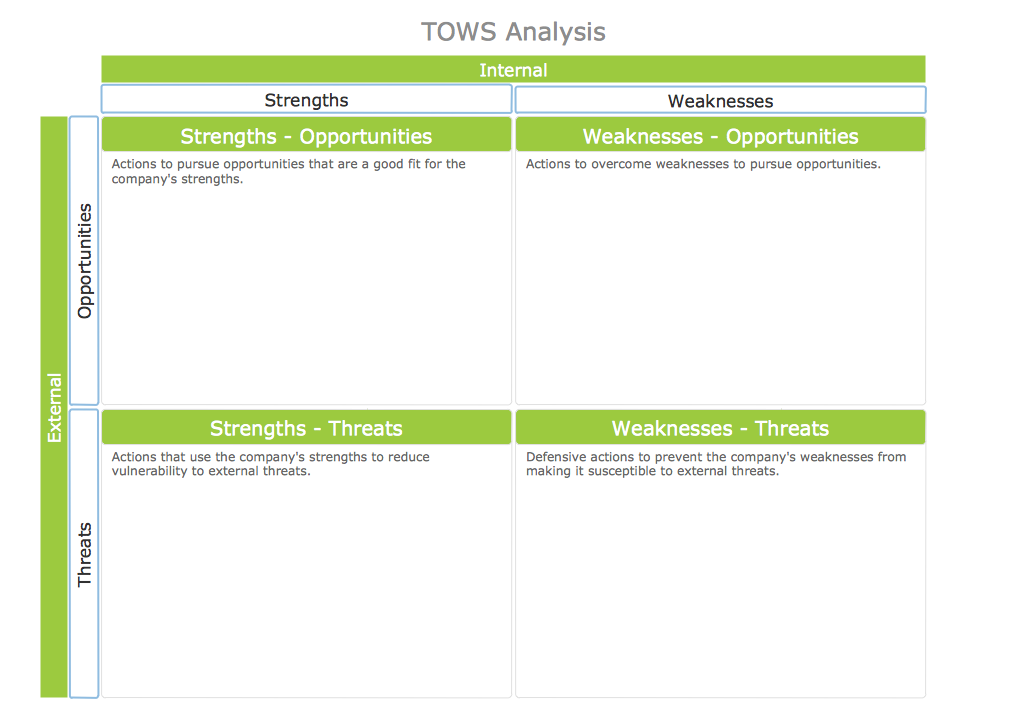
ConceptDraw DIAGRAM extended with unique SWOT and TOWS Matrix Diagrams Solution from the Management Area is a powerful software for effective TOWS analysis.
 Fault Tree Analysis Diagrams
This solution extends ConceptDraw DIAGRAM.5 or later with templates, fault tree analysis example, samples and a library of vector design elements for drawing FTA diagrams (or negative analytical trees), cause and effect diagrams and fault tree diagrams.
Feature Comparison Chart Software

This sample shows the Feature Comparison Chart of the digital scouting cameras. It can be useful for digital cameras production field, marketing, sales, etc.
- TOWS analysis matrix - Template | SWOT - Vector stencils library ...
- Fault Tree Analysis Software
- Fault Tree Analysis Diagrams
- Root cause analysis tree diagram - Template | How to Create a Fault ...
- SWOT Analysis | TOWS Analysis | SWOT Matrix | Swot Analysis For ...
- SWOT Analysis | SWOT and TOWS Matrix Diagrams | SWOT ...
- SWOT Analysis | SWOT analysis for a small independent bookstore ...
- FTA diagram - Hazard analysis | Accident analytic tree - FTA ...
- SWOT Analysis Solution - Strategy Tools | SWOT Analysis | TOWS ...
- HR steps - Vector stencils library
- SWOT Analysis | Design elements - SWOT and TOWS analysis ...
- SWOT Analysis Solution - Strategy Tools | SWOT Matrix Template ...
- TOWS Matrix | TOWS Analysis Software | TOWS Analysis | Tows ...
- Feature Comparison Chart Software | Bar Chart Template for Word ...
- BCG Matrix | SWOT analysis matrix diagram templates | Growth ...
- Tree Network Topology Diagram | Fault Tree Analysis Diagrams ...
- Management pictograms - Vector stencils library | Management ...
- SWOT Matrix Template | SWOT Analysis | SWOT Analysis Solution ...
- BCG Matrix | SWOT analysis matrix diagram templates | SWOT ...
- Positioning Map | Positioning map | SWOT analysis positioning ...
- ERD | Entity Relationship Diagrams, ERD Software for Mac and Win
- Flowchart | Basic Flowchart Symbols and Meaning
- Flowchart | Flowchart Design - Symbols, Shapes, Stencils and Icons
- Flowchart | Flow Chart Symbols
- Electrical | Electrical Drawing - Wiring and Circuits Schematics
- Flowchart | Common Flowchart Symbols
- Flowchart | Common Flowchart Symbols