- Electric and Telecom Plans Free
- Fire and Emergency Plans Free
- Floor Plans Free
- Plant Layout Plans Free
- School and Training Plans Free
- Seating Plans Free
- Security and Access Plans Free
- Site Plans Free
- Sport Field Plans Free
- Business Process Diagrams Free
- Business Process Mapping Free
- Classic Business Process Modeling Free
- Cross-Functional Flowcharts Free
- Event-driven Process Chain Diagrams Free
- IDEF Business Process Diagrams Free
- Logistics Flow Charts Free
- Workflow Diagrams Free
- ConceptDraw Dashboard for Facebook Free
- Mind Map Exchange Free
- MindTweet Free
- Note Exchange Free
- Project Exchange Free
- Social Media Response Free
- Active Directory Diagrams Free
- AWS Architecture Diagrams Free
- Azure Architecture Free
- Cisco Network Diagrams Free
- Cisco Networking Free
- Cloud Computing Diagrams Free
- Computer Network Diagrams Free
- Google Cloud Platform Free
- Interactive Voice Response Diagrams Free
- Network Layout Floor Plans Free
- Network Security Diagrams Free
- Rack Diagrams Free
- Telecommunication Network Diagrams Free
- Vehicular Networking Free
- Wireless Networks Free
- Comparison Dashboard Free
- Composition Dashboard Free
- Correlation Dashboard Free
- Frequency Distribution Dashboard Free
- Meter Dashboard Free
- Spatial Dashboard Free
- Status Dashboard Free
- Time Series Dashboard Free
- Basic Circle-Spoke Diagrams Free
- Basic Circular Arrows Diagrams Free
- Basic Venn Diagrams Free
- Block Diagrams Free
- Concept Maps Free
- Family Tree Free
- Flowcharts Free
- Basic Area Charts Free
- Basic Bar Graphs Free
- Basic Divided Bar Diagrams Free
- Basic Histograms Free
- Basic Line Graphs Free
- Basic Picture Graphs Free
- Basic Pie Charts Free
- Basic Scatter Diagrams Free
- Aerospace and Transport Free
- Artwork Free
- Audio, Video, Media Free
- Business and Finance Free
- Computers and Communications Free
- Holiday Free
- Manufacturing and Maintenance Free
- Nature Free
- People Free
- Presentation Clipart Free
- Safety and Security Free
- Analog Electronics Free
- Audio and Video Connectors Free
- Basic Circuit Diagrams Free
- Chemical and Process Engineering Free
- Digital Electronics Free
- Electrical Engineering Free
- Electron Tube Circuits Free
- Electronic Block Diagrams Free
- Fault Tree Analysis Diagrams Free
- GHS Hazard Pictograms Free
- Home Automation and Wiring Free
- Mechanical Engineering Free
- One-line Diagrams Free
- Power Сircuits Free
- Specification and Description Language (SDL) Free
- Telecom and AV Circuits Free
- Transport Hazard Pictograms Free
- Data-driven Infographics Free
- Pictorial Infographics Free
- Spatial Infographics Free
- Typography Infographics Free
- Calendars Free
- Decision Making Free
- Enterprise Architecture Diagrams Free
- Fishbone Diagrams Free
- Organizational Charts Free
- Plan-Do-Check-Act (PDCA) Free
- Seven Management and Planning Tools Free
- SWOT and TOWS Matrix Diagrams Free
- Timeline Diagrams Free
- Australia Map Free
- Continent Maps Free
- Directional Maps Free
- Germany Map Free
- Metro Map Free
- UK Map Free
- USA Maps Free
- Customer Journey Mapping Free
- Marketing Diagrams Free
- Matrices Free
- Pyramid Diagrams Free
- Sales Dashboard Free
- Sales Flowcharts Free
- Target and Circular Diagrams Free
- Cash Flow Reports Free
- Current Activities Reports Free
- Custom Excel Report Free
- Knowledge Reports Free
- MINDMAP Reports Free
- Overview Reports Free
- PM Agile Free
- PM Dashboards Free
- PM Docs Free
- PM Easy Free
- PM Meetings Free
- PM Personal Time Management Free
- PM Planning Free
- PM Presentations Free
- PM Response Free
- Resource Usage Reports Free
- Visual Reports Free
- House of Quality Free
- Quality Mind Map Free
- Total Quality Management TQM Diagrams Free
- Value Stream Mapping Free
- Astronomy Free
- Biology Free
- Chemistry Free
- Language Learning Free
- Mathematics Free
- Physics Free
- Piano Sheet Music Free
- Android User Interface Free
- Class Hierarchy Tree Free
- Data Flow Diagrams (DFD) Free
- DOM Tree Free
- Entity-Relationship Diagram (ERD) Free
- EXPRESS-G data Modeling Diagram Free
- IDEF0 Diagrams Free
- iPhone User Interface Free
- Jackson Structured Programming (JSP) Diagrams Free
- macOS User Interface Free
- Object-Role Modeling (ORM) Diagrams Free
- Rapid UML Free
- SYSML Free
- Website Wireframe Free
- Windows 10 User Interface Free
Sales Flowcharts
A person or an organization that expresses an interest in acquiring the previously offered item of value can be referred to as a potential buyer. They may be also referred to a prospective customer or simply a prospect. Such processes as selling and buying may be understood to be two sides of the same transaction.
Both sellers and buyers engage in a process of negotiation in order to consummate the exchange of values. The mentioned exchange process may be also called as a selling one. Having the implied rules as well as the identifiable stages. it may be implied that the selling process will proceed ethically and fairly. All the stages of selling and buying involve getting acquainted, determining whether the values to be exchanged are equivalent and assessing each party's need for the other's item of value.
Such terms as sales and marketing differ greatly. Nevertheless, they usually have the same goal. Selling is known to be the final stage in marketing. Marketing also includes such terms as promotion, place and product, pricing, etc. Any marketing department within some organization may have the goals of increasing the value and desirability to the customer. Marketers try to increase the number as well as the engagement of interactions between the organization and the potential customers.
Achieving the mentioned goal may involve the sales team using different promotional techniques: advertising, sales promotion, public relations, publicity, etc. At the same time, the processes within the "sales" term may be treated as the output of some larger system, not just as the output of one single department. Such larger system may include many functional areas within the same organization.
The Sales Flowcharts solution can be used while creating the sales and marketing-related drawings in the ConceptDraw DIAGRAM diagramming and drawing software. It provides all the ConceptDraw DIAGRAM users with a colourful as well as a comprehensive selection of sales themed symbols, flowchart icons and graphics allowing creating both informative and vivid sales process maps and workflow diagrams.
The Sales Flowcharts solution can be useful for everyone who is involved in the field of sales process management in order to display their sales results aesthetically and effectively.
-
Install this solution Free -
What I need to get started -
Solution Requirements - This solution requires the following products to be installed:
ConceptDraw DIAGRAM v17 - This solution requires the following products to be installed:
-
Compatibility - Monterey (12), Ventura (13), Sonoma (14)
MS Windows 8.1, 10 - Monterey (12), Ventura (13), Sonoma (14)
-
Support for this Solution -
Helpdesk
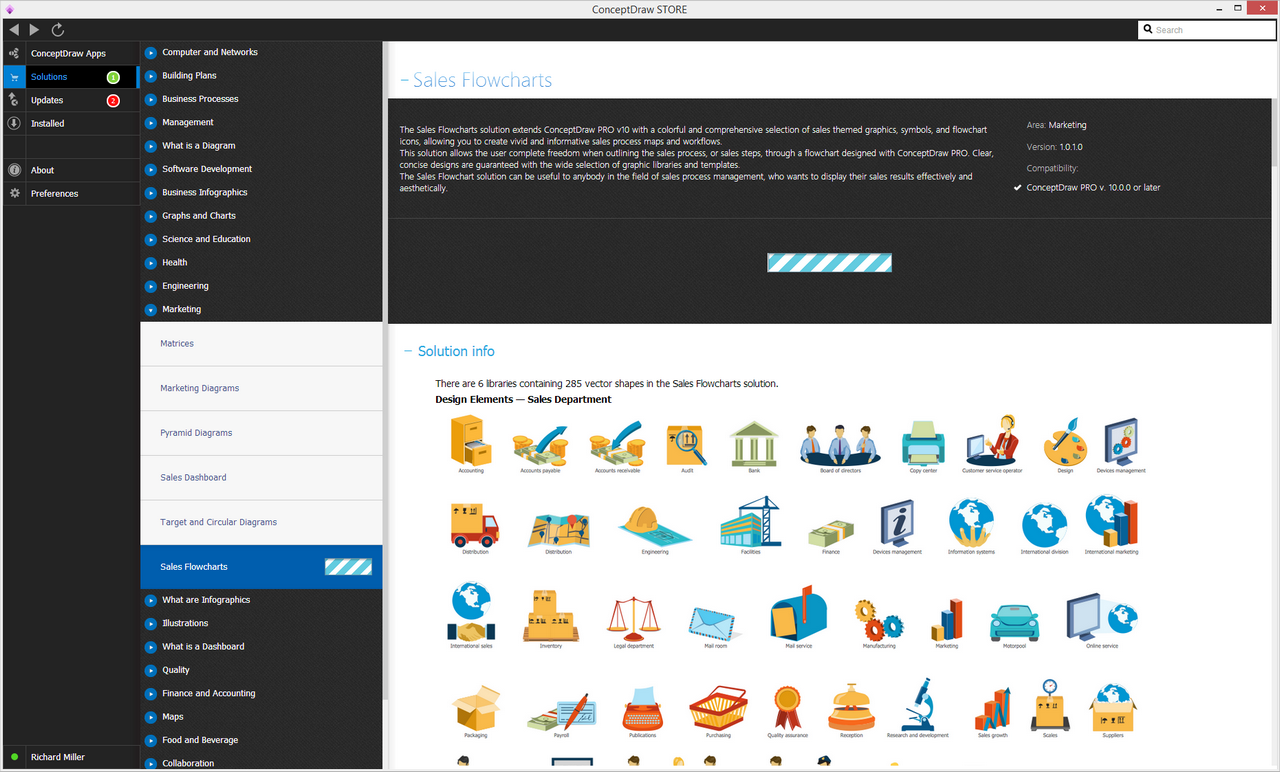
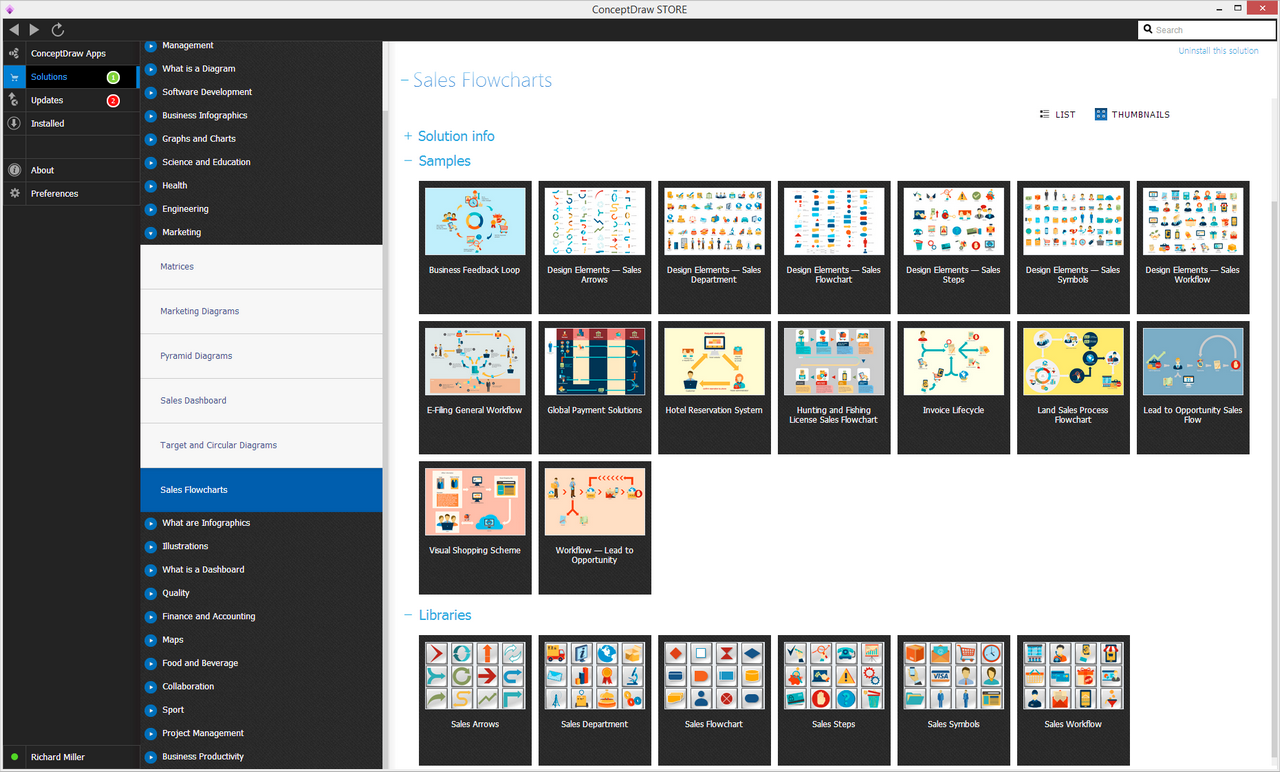
The Sales Flowcharts solution contains 10 examples and 6 libraries containing 285 vector graphics and objects.
Design Elements — Sales Department
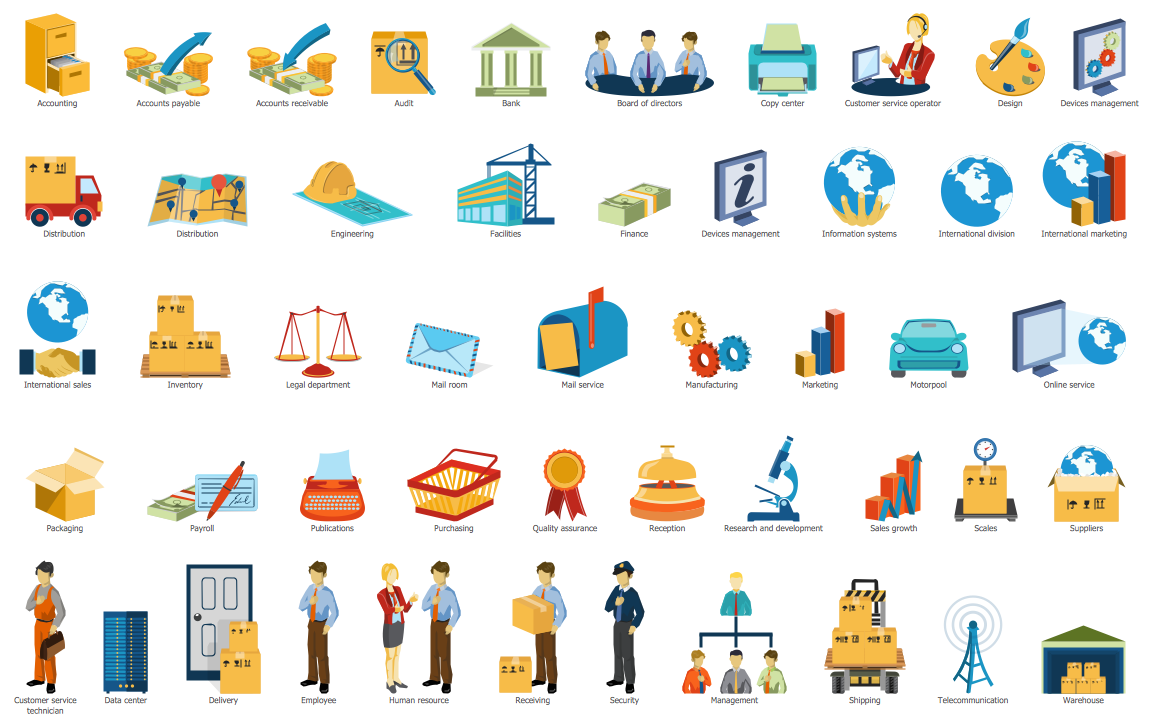
Design Elements — Sales Steps
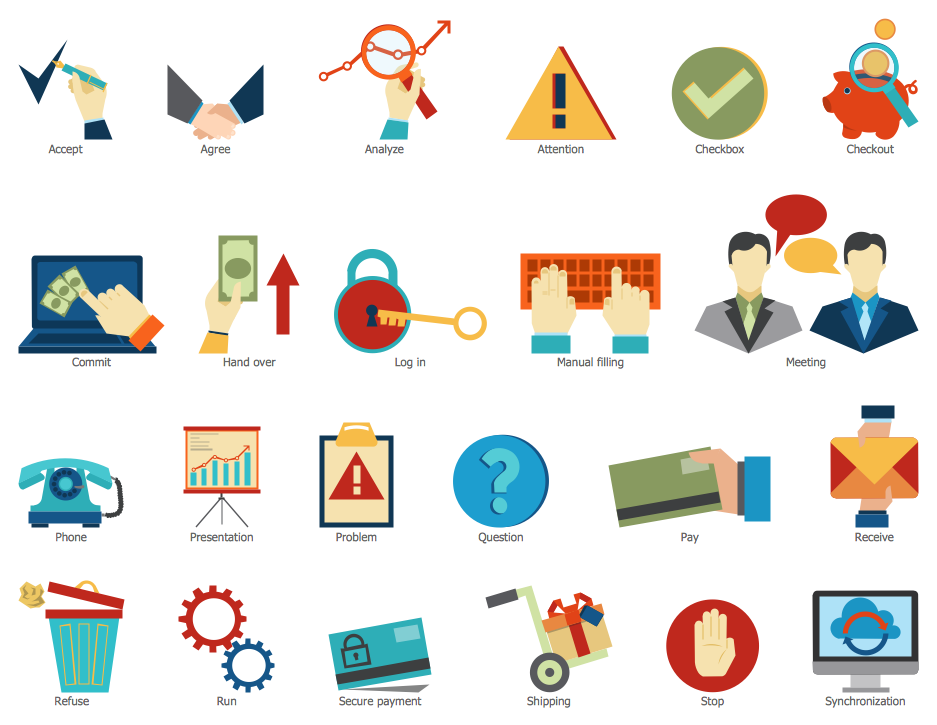
Design Elements — Sales Symbols
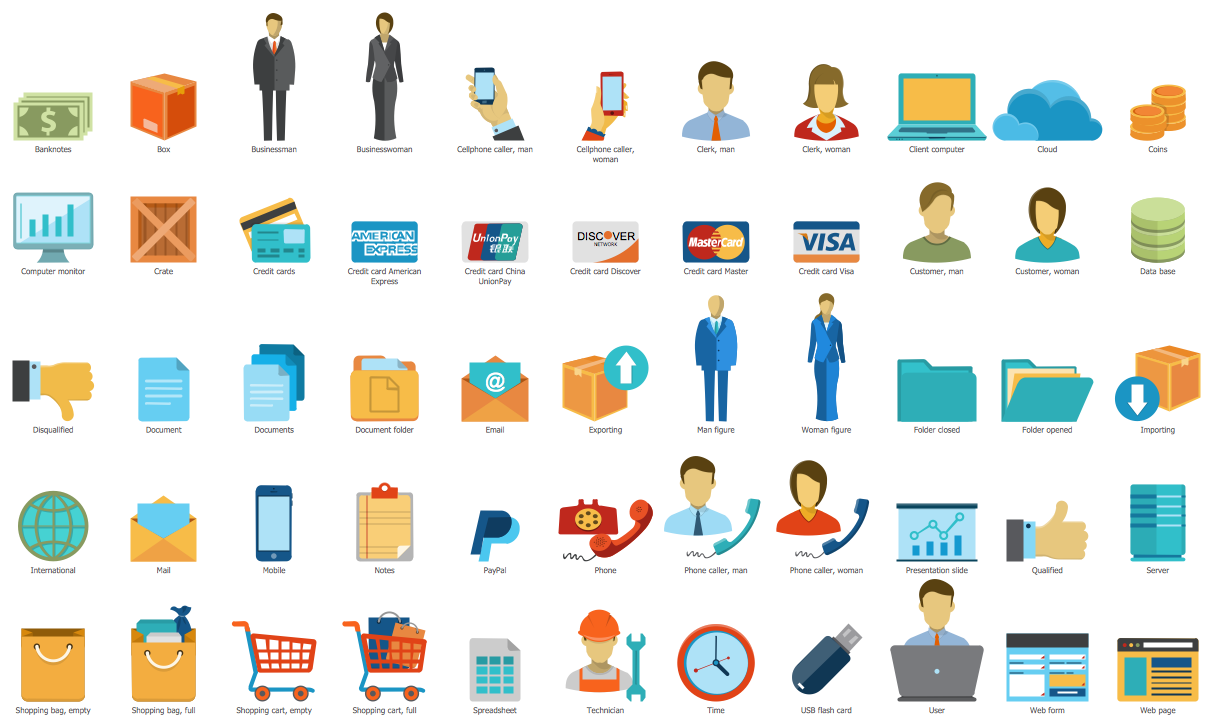
Design Elements — Sales Workflow

Design Elements — Sales Flowchart

Design Elements — Sales Arrows
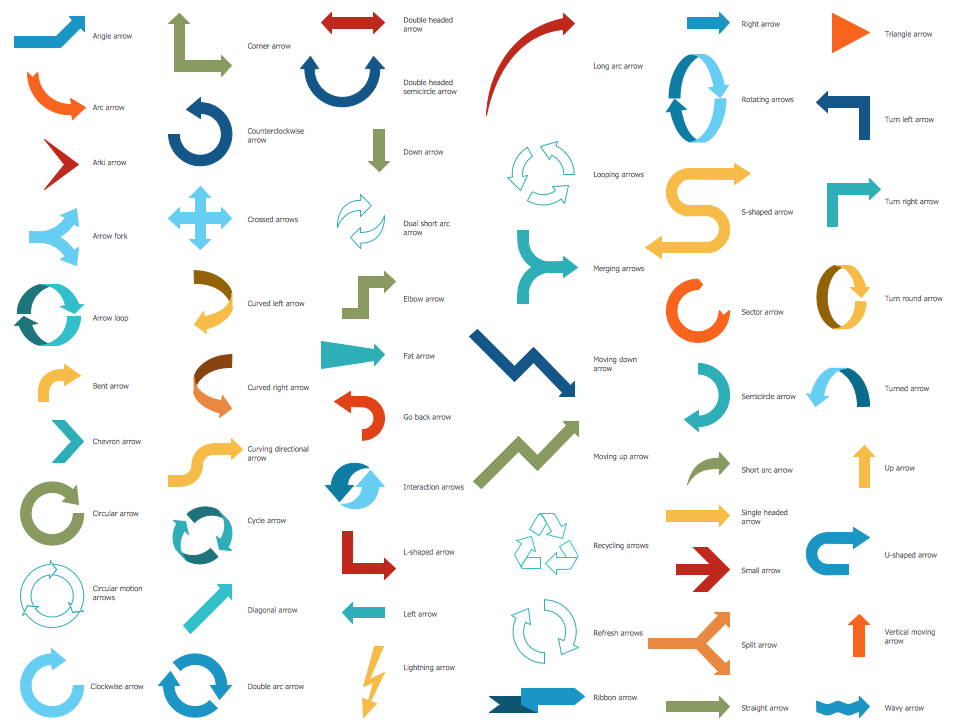
Examples
There are a few samples that you see on this page which were created in the ConceptDraw DIAGRAM application by using the Sales Flowcharts solution. Some of the solution's capabilities as well as the professional results which you can achieve are all demonstrated here on this page.
All source documents are vector graphic documents which are always available for modifying, reviewing and/or converting to many different formats, such as MS PowerPoint, PDF file, MS Visio, and many other graphic ones from the ConceptDraw Solution Park or ConceptDraw STORE. The Sales Flowcharts solution is available to all ConceptDraw DIAGRAM users to get installed and used while working in the ConceptDraw DIAGRAM diagramming and drawing software.
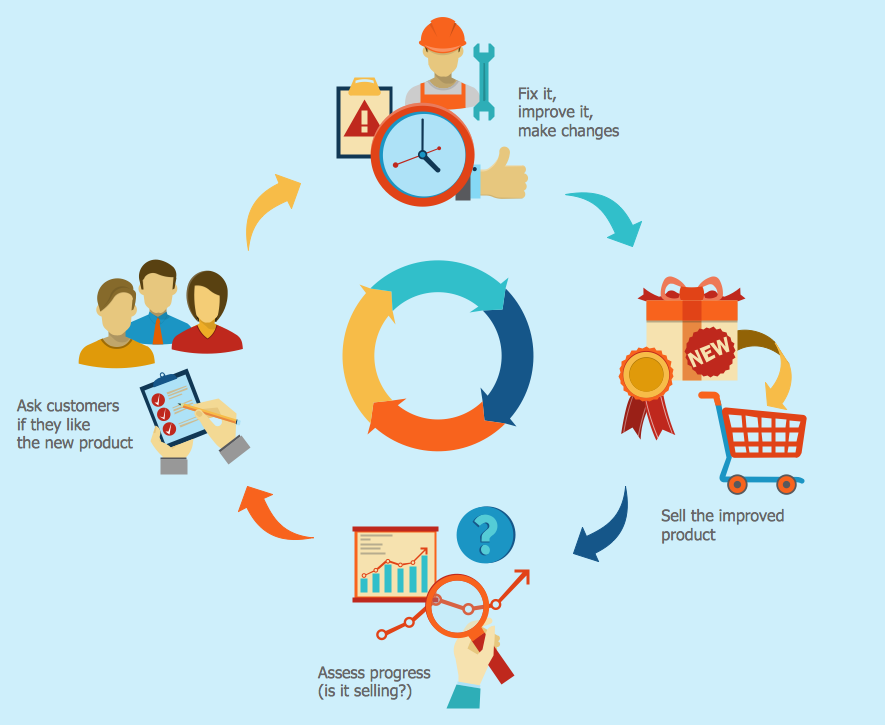
Example 1: Business Feedback Loop
This diagram was created in ConceptDraw DIAGRAM using the combination of libraries from the Sales Flowcharts solution. An experienced user spent 10 minutes creating this sample.
This Cycle process diagram shows the flowchart dedicated to the business feedback loop. This example is a typical Sales Flowchart, which was drawn by the forces of ConceptDraw DIAGRAM application on the base of Wikimedia Commons file "Business Feedback Loop PNG version.png". The feedback from the customers has a great value for business development and increasing sales. And really, according to this diagram you need to obligatory ask your customers if they like your new product, and in accordance to received feedback, if there are some disadvantages, you need to fix them, to improve and to make required changes, then to sell the improved product and to assess progress in selling. Use the ConceptDraw DIAGRAM application and Sales Flowcharts solution to create an informative and visually engaging Sales Process Flowcharts. The bright shades and chunky, stylized icons, symbols, pictograms and clipart mean you can add an artistic element to your flowchart design.
Example 2: Hotel Reservation System
This diagram was created in ConceptDraw DIAGRAM using the combination of libraries from the Sales Flowcharts solution. An experienced user spent 5 minutes creating this sample.
This Cycle process chart sample demonstrates the mechanism of work of a hotel's computer reservations system. It is a computerized system in which the information about hotels, tickets, car rental, and other touristic information is stored, and can be retrieved and processed. You can see that the process of reservation a room in a hotel using online reservation system on this hotel's website includes only few steps - the customer needs to fill out a request form on a hotel website, the hotel administrator receives this request by email and confirms the reservation to client by phone. As for design, its scope is completely up to you. Maybe you need a flowchart that presents a wide overview of the sales process, or perhaps as in this sample, you need to depict a small, circular workflow in a strict brief form. All required options are available to you with the help of the Sales Flowcharts solution.

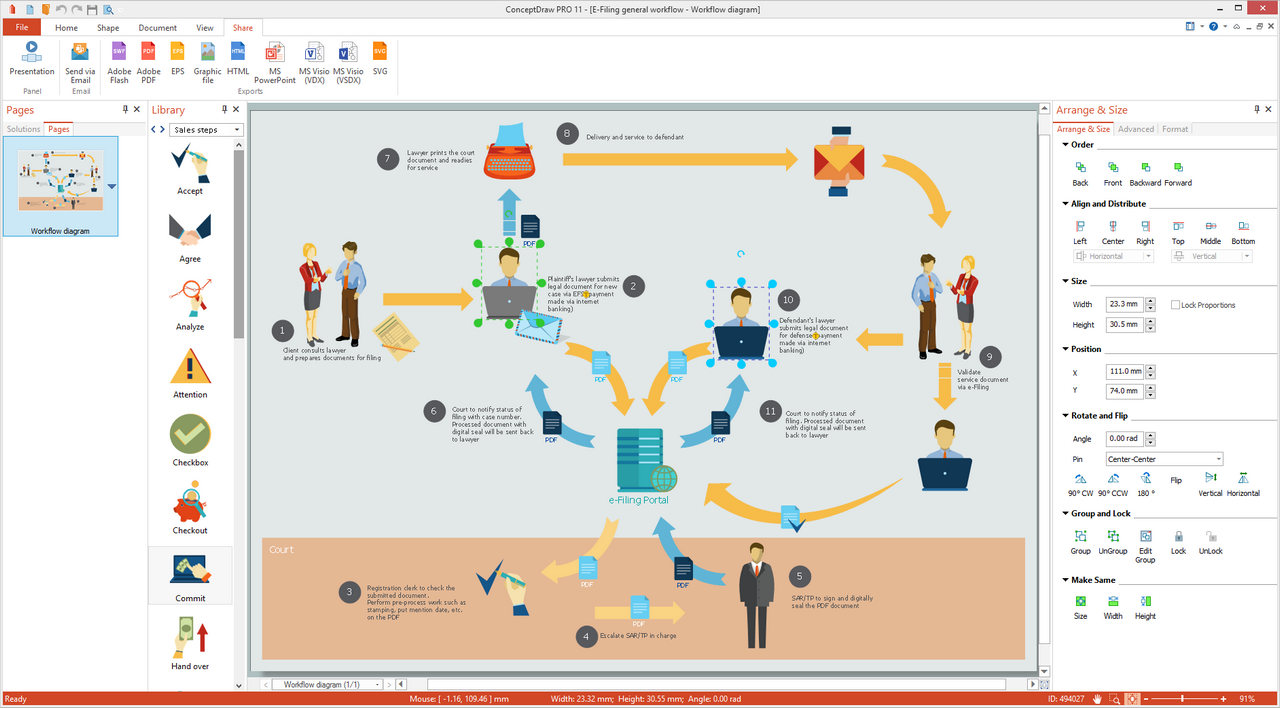
Example 3: E Filing General Workflow
This diagram was created in ConceptDraw DIAGRAM using the combination of libraries from the Sales Flowcharts solution. An experienced user spent 20 minutes creating this sample.
This Sales workflow diagram example has as the base the "Online submission" illustration offered on the e-Filing Portal of the Malaysian Judiciary. The e-Filing Portal was intended as a one-stop portal for the legal community and is used successfully for gaining the access to all set of required functions - from the registration of cases in the e-Filing System to the quick filing of case documents, and search of needed information and service documents. This portal provides also convenient feedback with lawyers allowing them to be notified about the status of their cases directly by email. A slightly more complex diagram in contrast to the previous examples is represented here, that uses a combination of text and graphics to strictly convey the inputs and outputs of a court filing system. ConceptDraw DIAGRAM software allows you to create coherent and clear Sales Process Flowcharts that are rich in information and data.

Example 4: Global Payment Solutions
This diagram was created in ConceptDraw DIAGRAM using the combination of libraries from the Sales Flowcharts solution. An experienced user spent 15 minutes creating this sample.
This flowchart demonstrates a global payment process realized using the special global payment solutions. It was constructed on the base of the diagram illustrating the payment process using Global Payment Processing Services offered on the website of U.S. Securities and Exchange Commission. The Global Payment Processing Services provide an ability to make payments and accordingly to accept payments on all major credit and debit cards. There are depicted all stages that payment passes from the moment when a cardholder makes the purchase and pays it to the moment when a merchant receives this payment, including the authorization, verification, batching, clearing and settlement, and funding. The structures involved in a payment process are also represented in this flowchart diagram, among them there are CyberSource, Acquiring Bank, Card Associations and Issuing Bank. The Sales Flowcharts solution from the ConceptDraw Solution Park is a great tool for anyone involved in sales process management.

Example 5: Hunting and Fishing License Sales Flowchart
This diagram was created in ConceptDraw DIAGRAM using the combination of libraries from the Sales Flowcharts solution. An experienced user spent 20 minutes creating this sample.
This Sales Flowchart example was created using as the base the "Hunting and fishing license" flowchart taken on the COMPASS portal of the Department of Natural Resources, Maryland, Unites States. The hunting and fishing are the licensed processes in many countries, cities and states, in particular in Maryland, and you need to have official access to them. You can't just cast your rod and to fish where you please, and at what time and season you want, you'll need one of the fishing licenses sold using the sales process shown on this sample. You need to pass the following steps: to select a product, to decide on suggested products, to review and to confirm shopping cart, to confirm address information, to answer survey questions, to submit payment, to specify the inventory fulfilment method and finally to print a received license. A Sales Flowchart can be useful for staff and customers alike, and couldn't be easier to create than thanks to ConceptDraw DIAGRAM software.

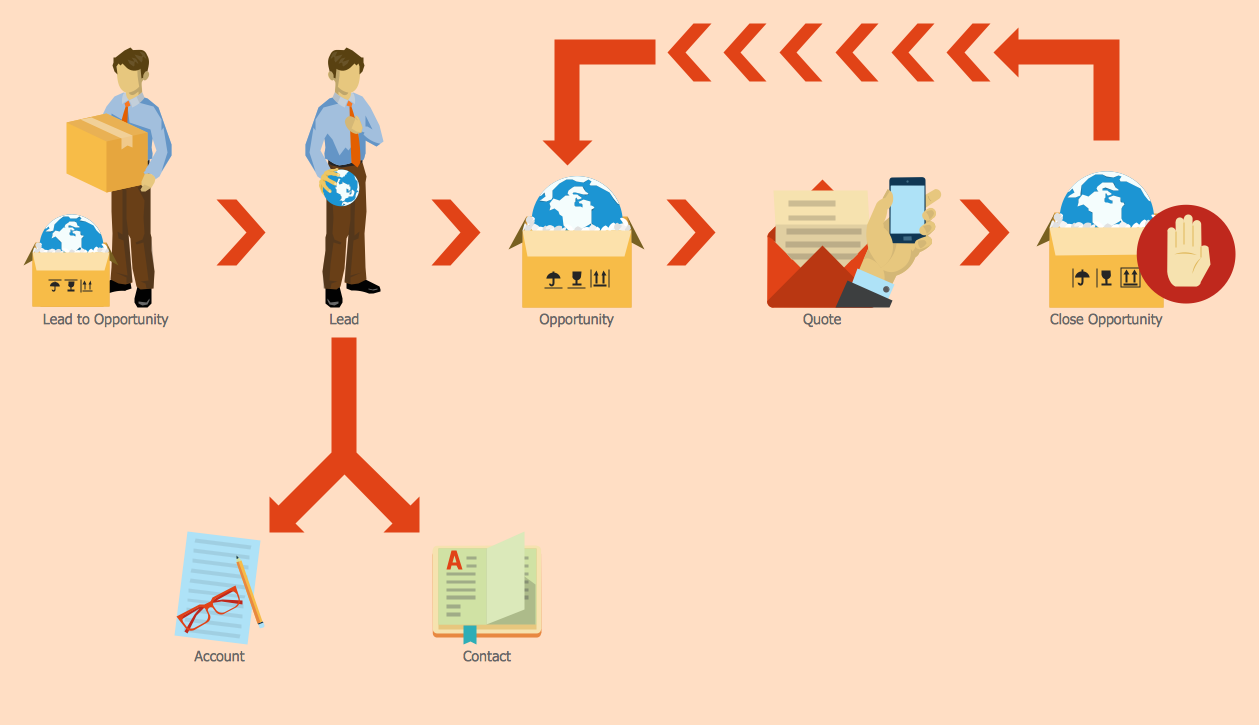
Example 6: Workflow Lead to Opportunity
This diagram was created in ConceptDraw DIAGRAM using the combination of libraries from the Sales Flowcharts solution. An experienced user spent 5 minutes creating this sample.
This Sales flowchart sample reflects the Microsoft Dynamics CRM workflow from the lead to opportunity. The sample is based on the diagram taken from the Wikimedia Commons file "Lead to Opportunity sales flow.svg" and was redesigned in ConceptDraw DIAGRAM software applying the tools of the Sales Flowcharts solution offered by Marketing area of ConceptDraw Solution Park. The qualification of your lead in Microsoft Dynamics CRM lets convert it to an opportunity. This Sales flowchart is clear and strict, all flow steps are represented in a simple and precise form using the arrows and clipart in addition to the compact text information. Any your own Sales Flowchart can be resembling this sample when designed in ConceptDraw DIAGRAM. Each ConceptDraw user can show a workflow at multiple hierarchical levels across and entire business, on a single Flowchart diagram, thanks to the wide array of graphics and templates at their disposal in ConceptDraw STORE.
Example 7: Visual Shopping Scheme
This diagram was created in ConceptDraw DIAGRAM using the combination of libraries from the Sales Flowcharts solution. An experienced user spent 20 minutes creating this sample.
This Sales flowchart example based on the Wikimedia Commons file "Visual shopping scheme.pdf" step-by-step illustrates the online shopping mechanism. The e-shopping or online shopping is very popular nowadays, and its popularity grows more and more day by day in all over the world. It is a form of commerce that lets the Internet customers make different kinds of purchases being in any place in a world, without leaving their homes and offices, and without spending a lot of time going shopping. It allows choosing a product or a service via the Internet on the seller's website or in a specialized application, to read its detailed description, to compare the similar products with each other and to make a purchase immediately. Moreover, in many cases in this way you can buy the product directly on the manufacturer's site without intermediaries and extra payments for costs, such as rent, salary of sellers, etc.

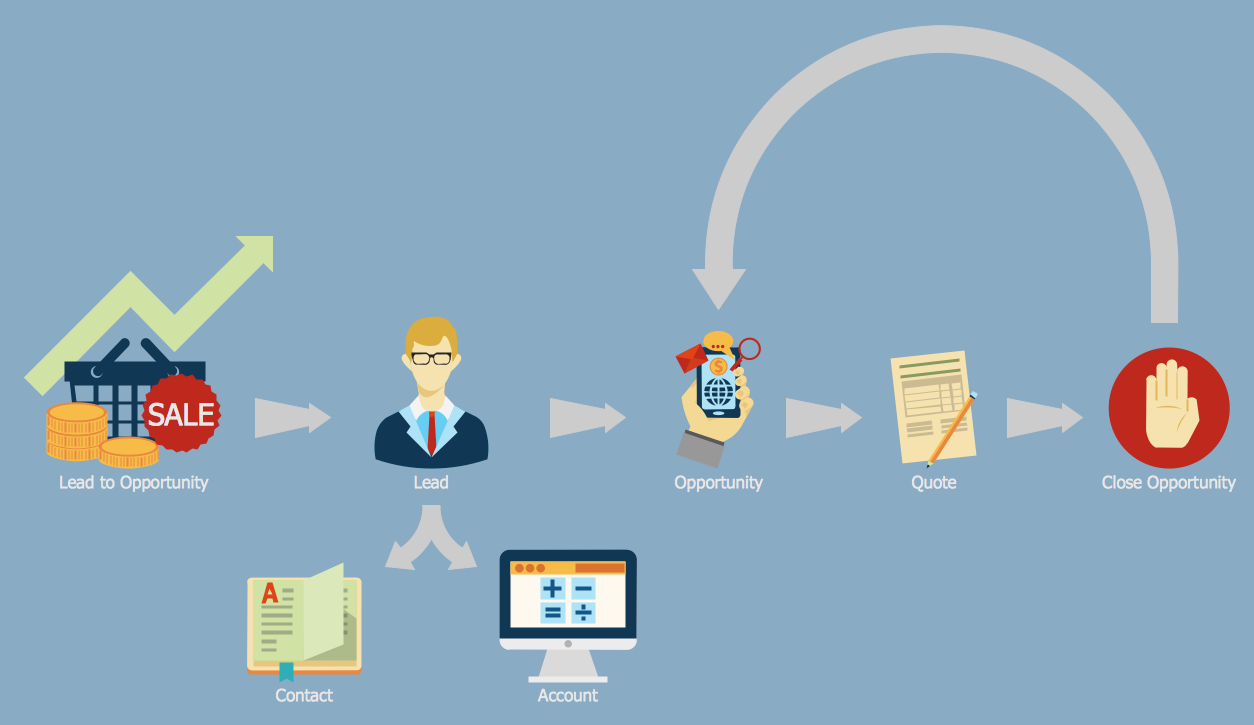
Example 8: Lead to Opportunity Sales Flow
This diagram was created in ConceptDraw DIAGRAM using the combination of libraries from the Sales Flowcharts solution. An experienced user spent 5 minutes creating this sample.
This Sales Flowchart shows the presales process, the main goal of which is to lead to opportunity sales flow. The presales is an important process including several stages and taking place before the customer's purchase will be made. It begins from the initial contact of a presales specialist with a customer, or long before this moment, and ends by the completed customer's purchase. Typically, the sales process contains three stages: Contact, Lead / Suspect, and Prospect / Opportunity. You can observe the Microsoft Dynamics CRM workflow from lead to opportunity on this Sales Flowchart. Designed in ConceptDraw DIAGRAM application, this flowchart is based on the Wikimedia Commons file "Lead to Opportunity sales flow.svg". It is visual and professional-looking, and precisely reflects all stages of a given sales flow. It is an ideal sample to make the choice in favor of ConceptDraw DIAGRAM software designing the flowcharts of different kinds.
Example 9: Land Sales Process Flowchart
This diagram was created in ConceptDraw DIAGRAM using the combination of libraries from the Sales Flowcharts solution. An experienced user spent 15 minutes creating this sample.
This sample represents the flowchart of the land sales process in state of Victoria, Australia. It is based on the illustrations from the Property management webpage of VicRoads (Roads Corporation of Victoria) website. There are represented all stages that need to be proceed before the property will be offered for sale. The combination of different visual forms is an excellent support in a process of designing diagrams, and it is coming not only about clipart, pictures, icons, symbols, but also about the use of additional charts and graphics within a diagram that you are constructing now. Thus, on this flowchart in addition to bright and colorful clipart, you can observe a Cycle diagram of the sales actions. Position consistently the steps of your flow and maintain the distance between them, do not saving the space. Remember that the clarity and accuracy are key to success in construction the Sales flowcharts.

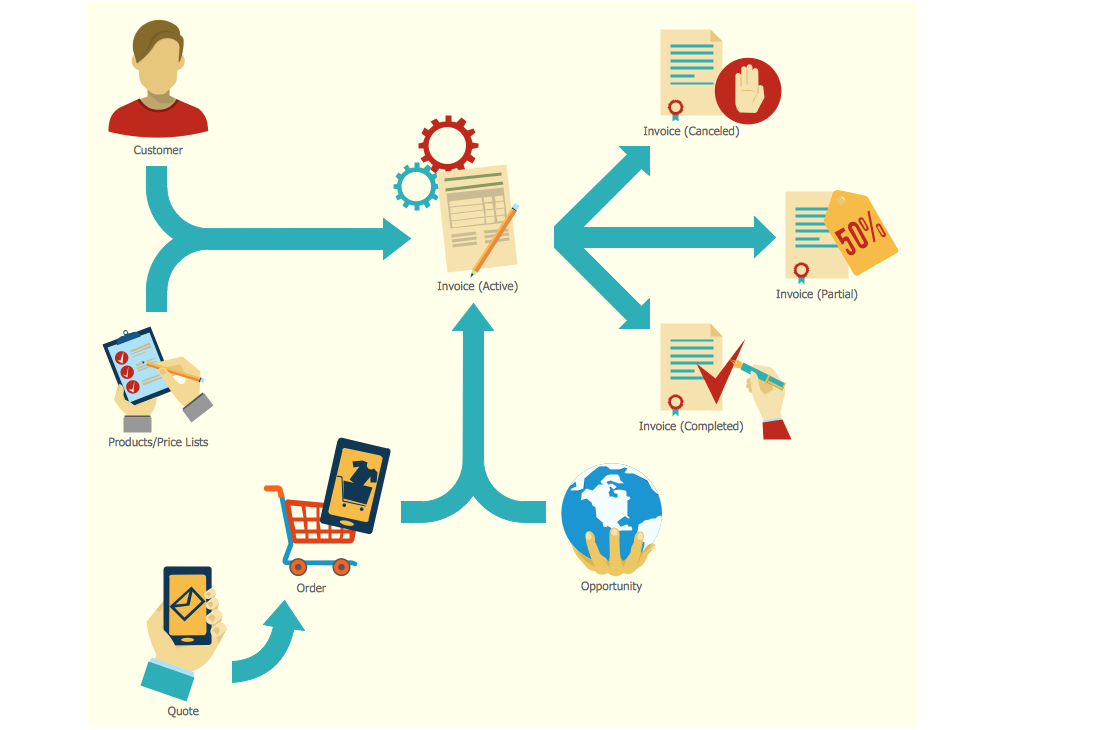
Example 10: Invoice Lifecycle
This diagram was created in ConceptDraw DIAGRAM using the combination of libraries from the Sales Flowcharts solution. An experienced user spent 10 minutes creating this sample.
This Sales flowchart example shows the lifecycle of an invoice in Microsoft Dynamics CRM. Having as the base the Wikimedia Commons file "Invoice lifecycle.svg", this sample was designed only by use of ConceptDraw DIAGRAM drawing tools. The Microsoft Dynamics CRM developed by Microsoft Corporation is a special server-client software package with extensive web services interfaces, directed on the customer relationship management and focused also on the sales, marketing and services. When making your diagrams and flowcharts pay special attention to design, style and color gamma, because the text information supplemented by visual figures is perceived easier and faster by the audience, and not only marketing, business, or management-related, but also any other audience. In particular, the ConceptDraw's Sales Flowcharts solution from the Marketing area of ConceptDraw Solution Park is quite effective in a field of marketing and sales, and correctly applied is powerful in enhancement sales volume in short terms.
Inside

What I Need to Get Started
Both ConceptDraw DIAGRAM diagramming and drawing software and the Sales Flowcharts solution can help creating the marketing and sales communication diagrams you need. The Sales Flowcharts solution can be found in the Marketing area of ConceptDraw STORE application that can be downloaded from this site. Make sure that both ConceptDraw DIAGRAM and ConceptDraw STORE applications are installed on your computer before you get started.
How to install
After ConceptDraw STORE and ConceptDraw DIAGRAM are downloaded and installed, you can install the Sales Flowcharts solution from the ConceptDraw STORE.
Start Using
To make sure that you are doing it all right, use the pre-designed symbols from the stencil libraries from the solution to make your drawings look smart and professional. Also, the pre-made examples from this solution can be used as drafts so your own drawings can be based on them. Using the samples, you can always change their structures, colors and data.
Sales Process Flowcharting
Should a business or government agency need to visualize a solution model for a some aspect of their business, there is a good chance that resulting diagram will take the form of a flowchart. They are an invaluable tool when charting a sales process — they give you the opportunity to visualise and understand the process, and also serve to highlight any issues or bottlenecks that might occur throughout the workflow. As an example of how ubiquitously intertwined flowcharts are with business process, here are a number of synonyms that may also be used:
- Flow chart
- Process flowchart
- Functional flowchart
- Process map
- Process chart
- Functional process chart
- Business process model
- Process model
- Process flow diagram
- Work flow diagram
- Business flow diagram
In its most basic form, a flowchart consists of a series of steps that act as a diagrammatic representation of a simple problem or process. Each step is represented graphically by a box — most commonly a square (representing processing steps or an activity), or a diamond (representing a decision). These boxes are linked by arrows, that indicate the direction of the workflow.

A flowchart doesn't so much represent the flow itself; rather, it focuses on the controls that govern the flow.
In practical terms, individual algorithms, workflows or processes can require a specific approach when designing, documenting or analyzing a flow chart. This has resulted in a widened selection of boxes and icons to cater for more niche controls and commands, and several flowchart variants stemming from the 'classical notation' style (the basic style outlined above). For instance, you can make a flowchart 'cross-functional', by introducing swimlanes that divide a process into organizational units. You also need to decide on your chart's perspective — is it from a managers, system analyst, or customer's point of view? A workflow diagram connects multiple processes, and allows you to define execution responsibility.
Flowcharts can be subdivided even further in accordance to what type of process they describe:
- Decision
- Logic
- Systems
- Product
- Process
- Program
- Document
- Data
The Sales Process
For most commercial organizations, the sales process is inherent to its existence and ability to create profit. Although each company will achieve this aim in its own way, the core selling process remains similar throughout — a potential buyer or prospective customer exchanges money with an organization in return for goods or services. Despite this rather simplistic definition, there exists huge scope as to which approach is taken. Indeed, it is not uncommon for the sales division to be the largest within a corporate structure, employing a team of salespeople, analysts, and the sales managers, who are in charge of sales division operations.
Sales operations is an umbrella term for all the processes and business activities that a key to running a sales division. The sales operation team is responsible for its smooth and efficient running, and to act as a liaison between other parts of company structure, such as IT, Legal, HR, Finance, or Marketing. There is a continual focus on sales process engineering, which is the analysis and refinement of a sales process in order to increase its efficiency or to identify problems within the workflow; other benefits might include the ability to standardize customer response into the form of a process, or as a platform to conduct buyer and seller risk management. A sales process itself is defined by strategy, sales targets, quotas, forecasting and demand; some theories also ascribe to a generic framework to build your process around — Rich, Spiro and Stanton identify 8 steps that make up a sales process in Management of a Sales Force (12th Ed. p. 66). They are as follows:
- Prospecting/initial contact
- Pre-approach — planning the sale
- Identifying and cross questioning
- Need assessment
- Presentation
- Meeting objections
- Gaining commitment
- Follow-up
The ideal method with which to represent these step-by-step processes is through the flowchart medium.
Charting The Flow

The practical applications of sales process flowcharts are numerous and wide ranging. At sales level, you might map the process of customer interaction, from first contact to sale. Or a system flowchart, that depicts the flow of actual physical elements or company resources. A program flowchart can be used to process map a software system for an online shop. For a manager, a sales process can generate key performance indicators, that allow senior management to discern the effectiveness of a process, and take corrective action if needed. The main aim is ongoing quality and margin improvement, process refinement and study of effectiveness. To take this concept even further, there are a number of 'doctrines' that some practitioners will apply to business process mapping.
Six Sigma is not only a set of tools and techniques to assist with your sales process diagrams, it is more like a doctrine for the whole company to follow. It shares the main ideals of process analysis and refinement, but adds focus on financial return, emphasis on strong leadership, and a rule to only ever make decisions based on verifiable data and statistical analysis. Following a similar pattern is ISO 9001, which represents a quality management system with a strict set of guidelines. Now adopted round the globe, it has become the de facto quality standard for business, and its application is routinely assessed by a third party. What both of these systems do is apply process mapping theory to every aspect of an organization; flowcharts provide the flexibility with which to do this.
As you can see, a simple premise like a sale process flowchart can culminate in an almost endless array of options and elements, not to mention the constant need for updating and refinement. Once again, ConceptDraw have produced a solution that allows you full freedom of expression when creating your sales flowcharts. The Sales Flowcharts solution for ConceptDraw DIAGRAM provides you with six sizable vector stencil libraries, including the full set of classical flowchart notation symbols, as well as stylized pictograms and arrows that bring energy and color to your design. It is ideal for users of all experience levels — beginners are catered for with handy templates and lessons that help you get the most out of the solution. Leave no process unmapped with the Sales Flowcharts solution from ConceptDraw.